Plot Combined Clusterings Results
plot.clustCombi.RdPlot combined clusterings results: classifications corresponding to Mclust/BIC and to the hierarchically combined classes, "entropy plots" to help to select a number of classes, and the tree structure obtained from combining mixture components.
Arguments
- x
Object returned by
clustCombifunction.- what
Type of plot.
- ...
Other arguments to be passed to other functions:
combiPlot,entPlot,combiTree. Please see the corresponding documentations.
Value
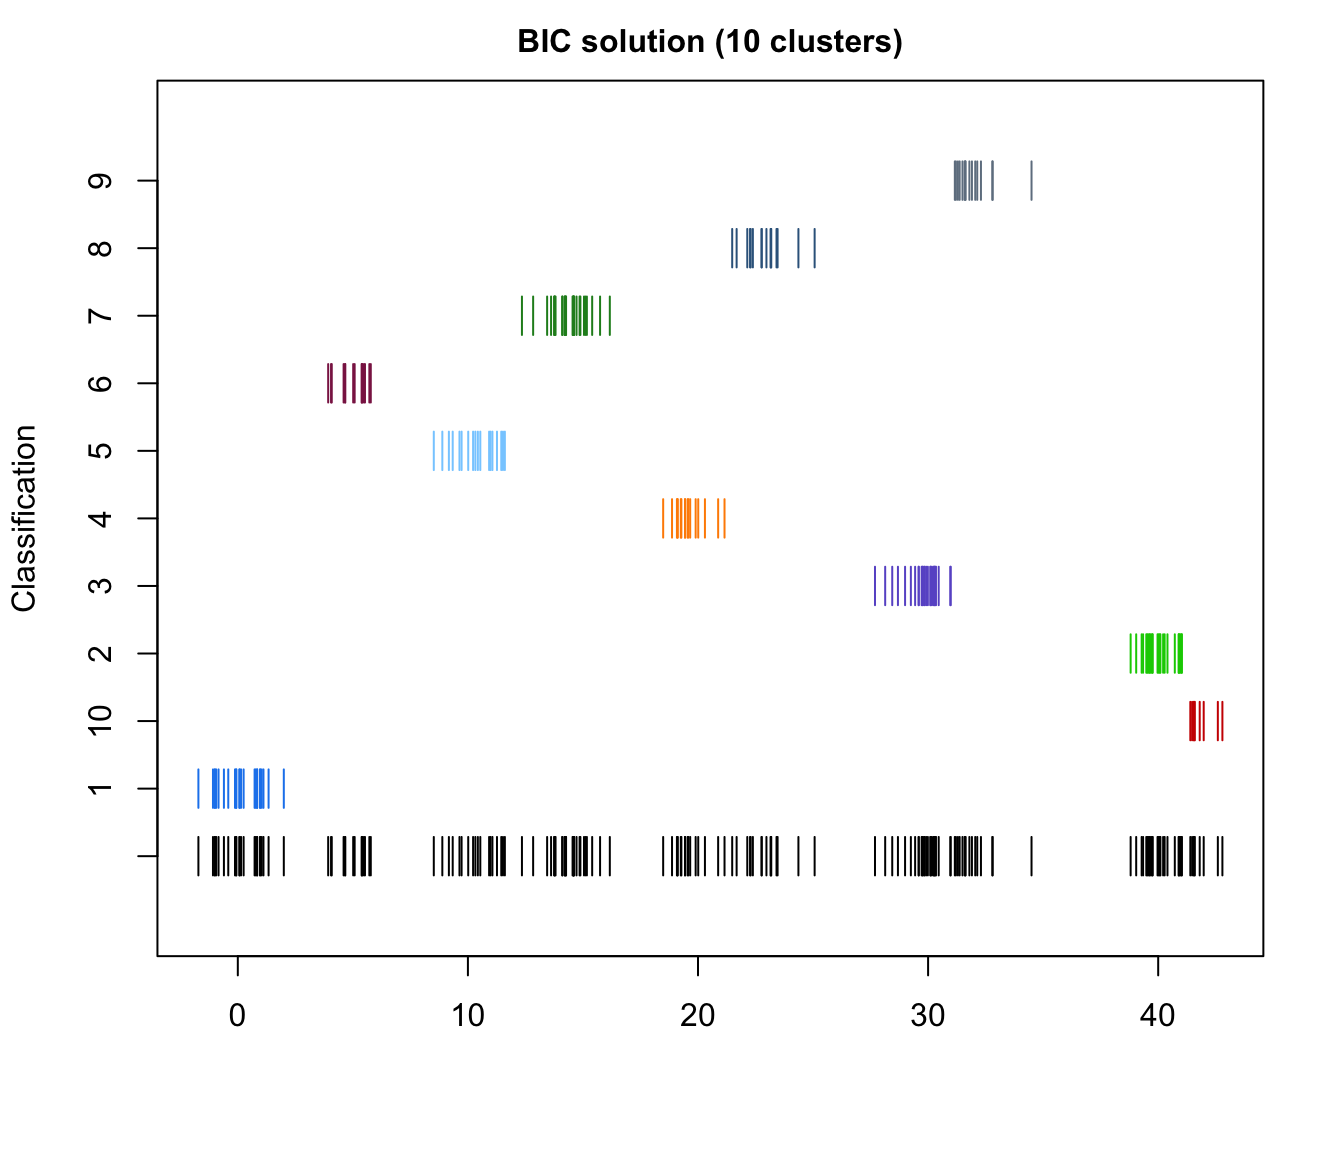
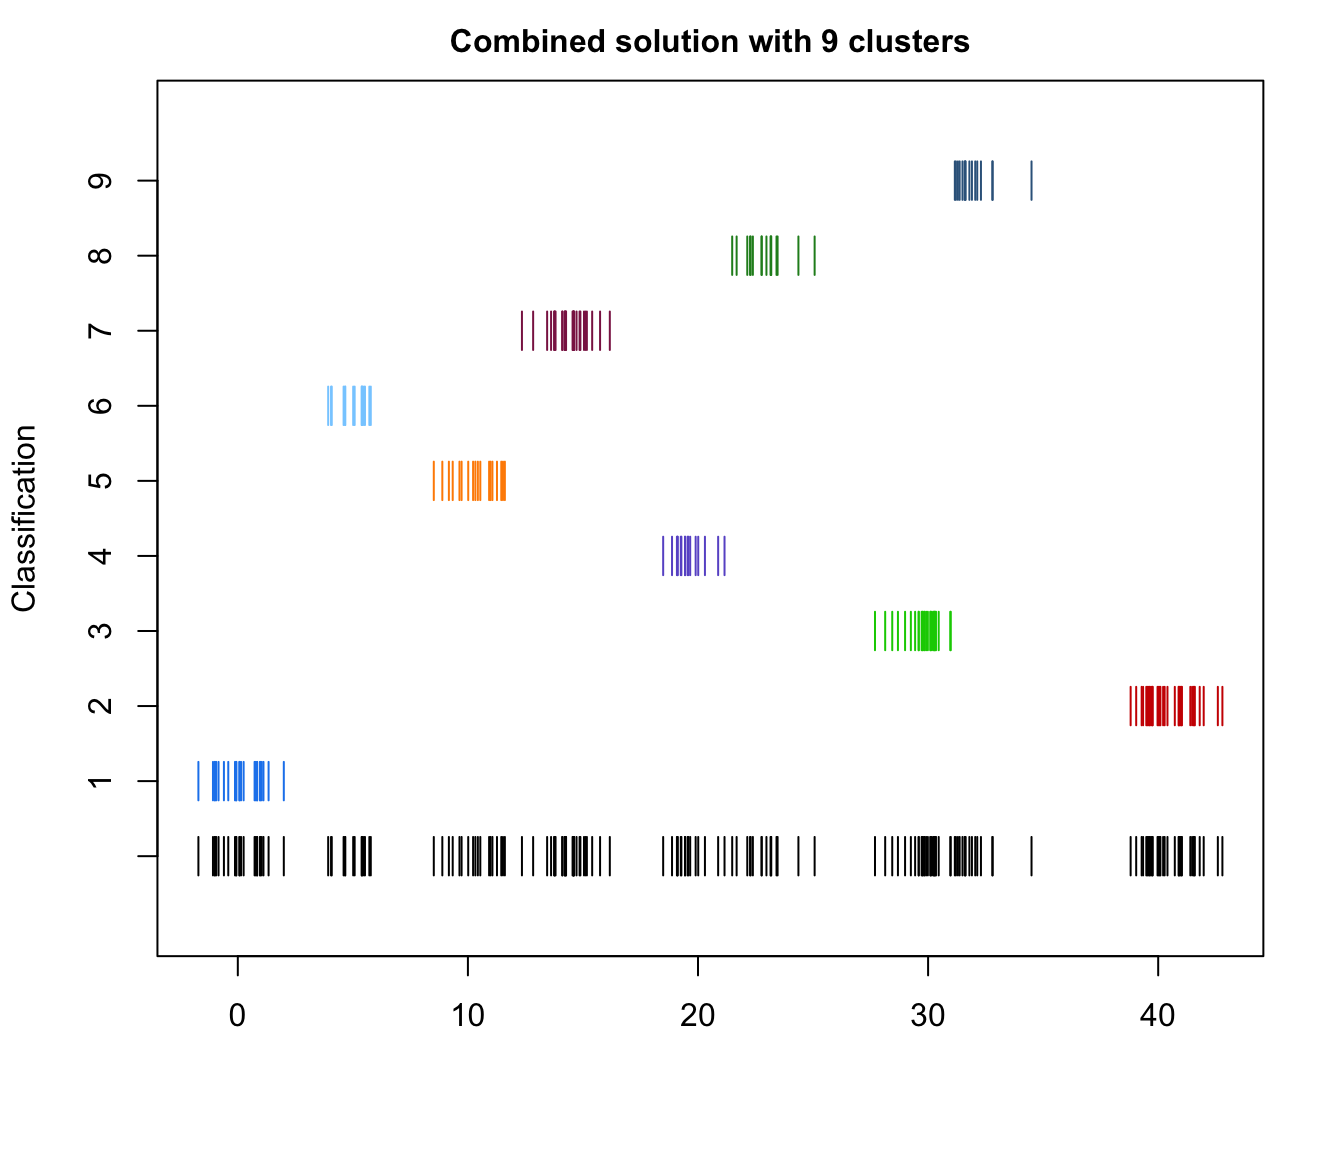
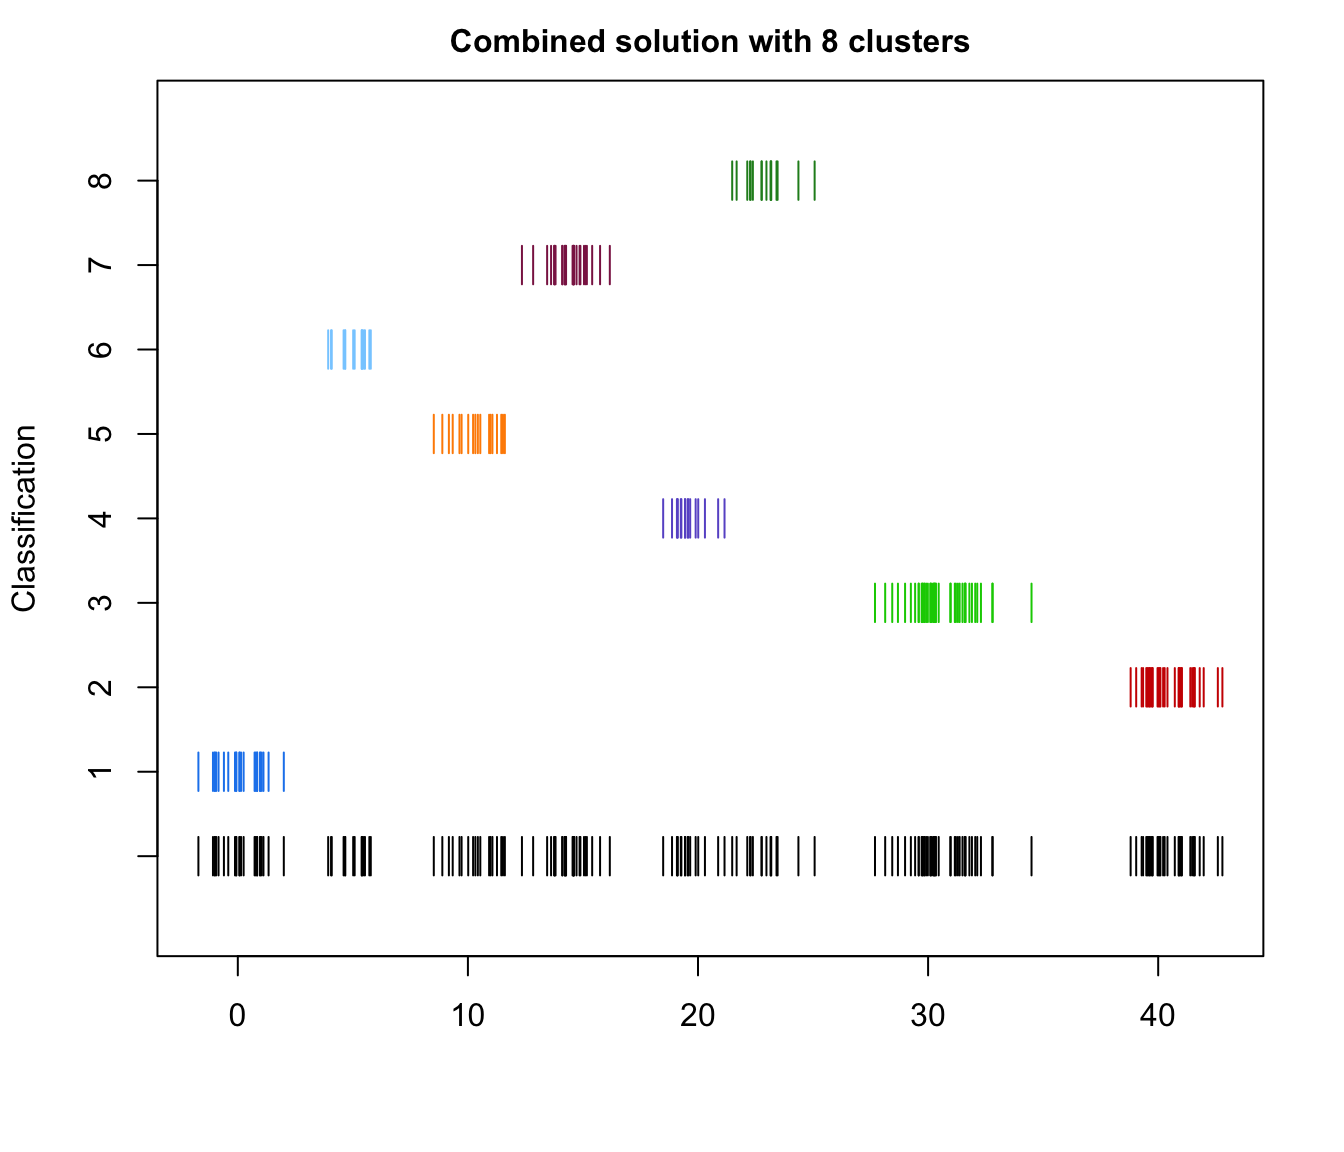
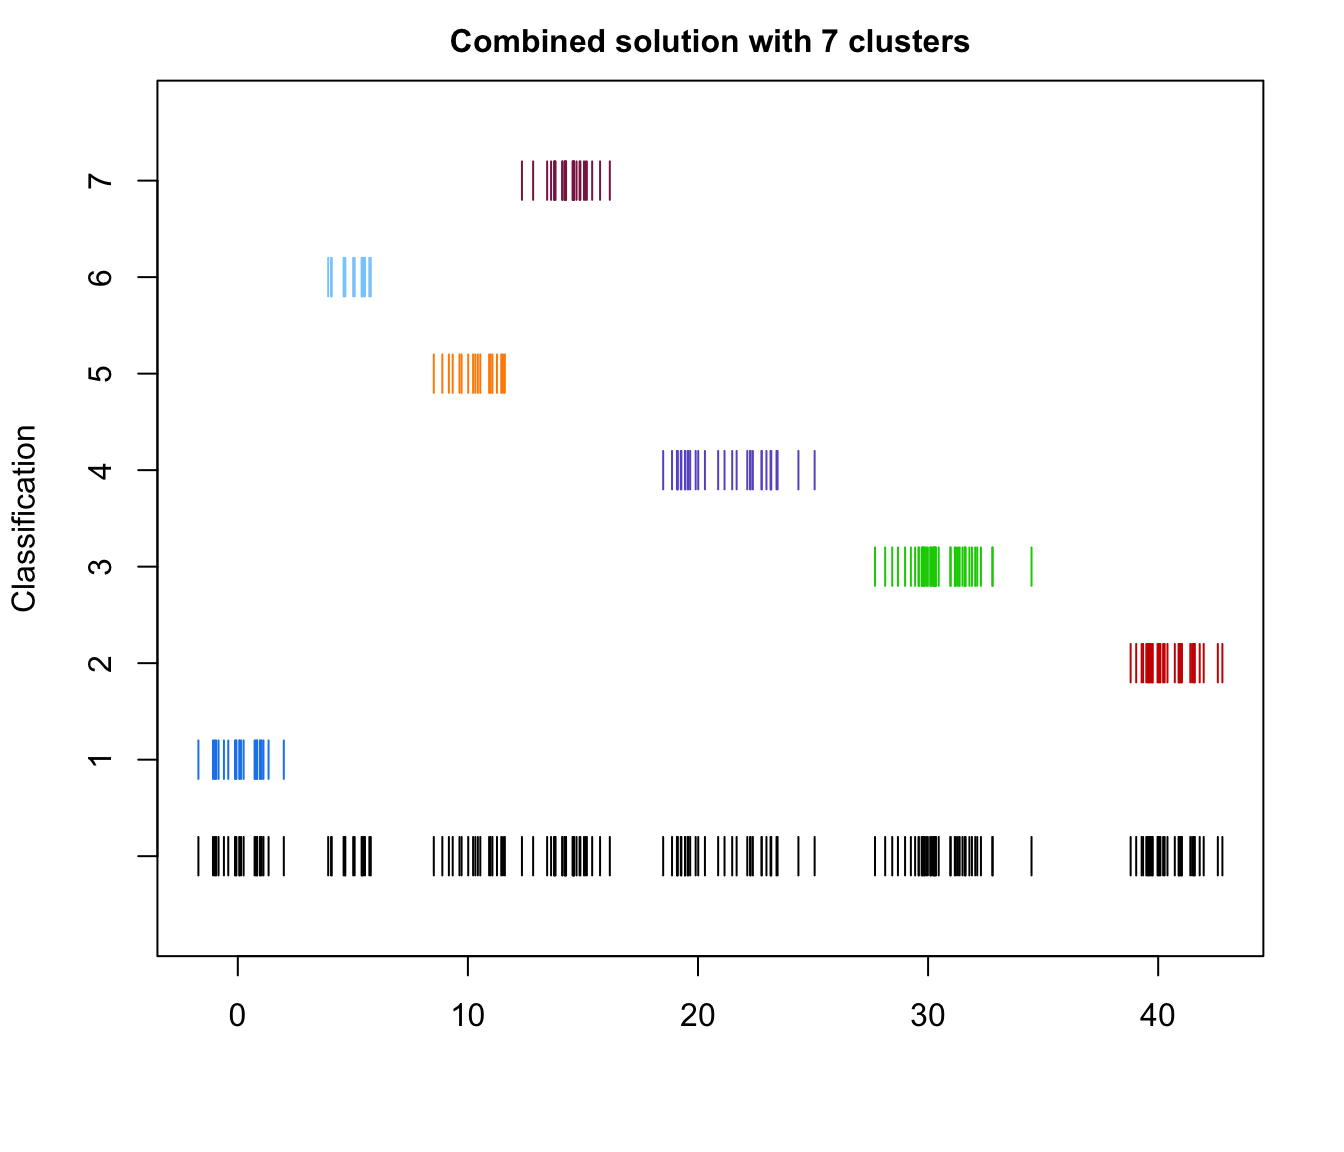
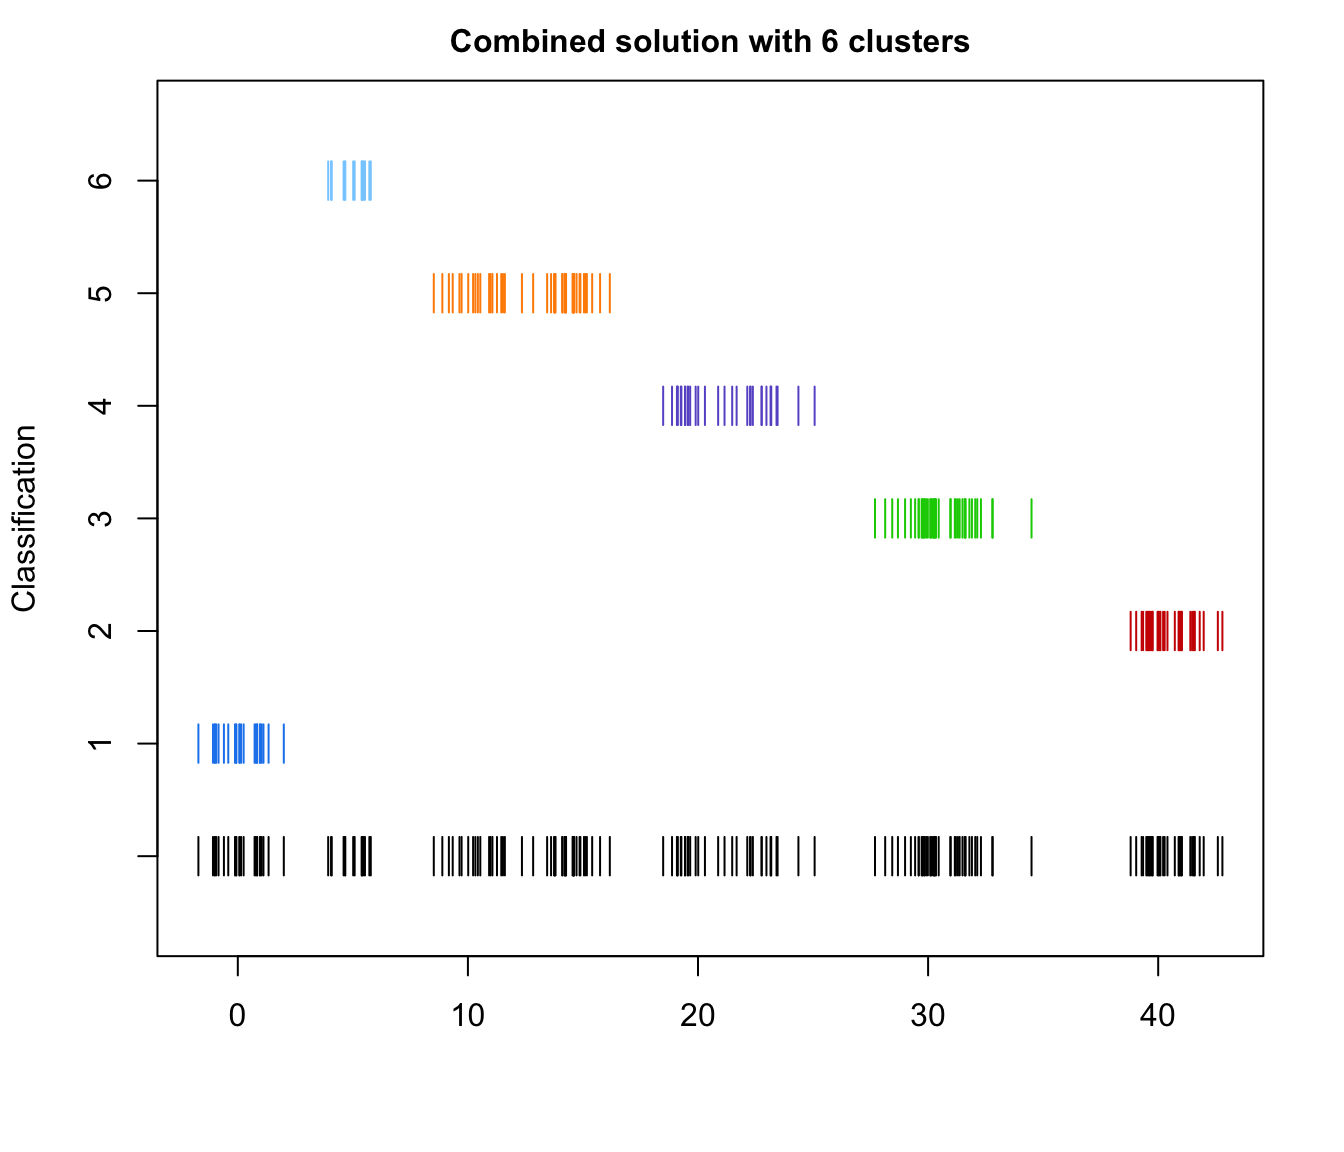
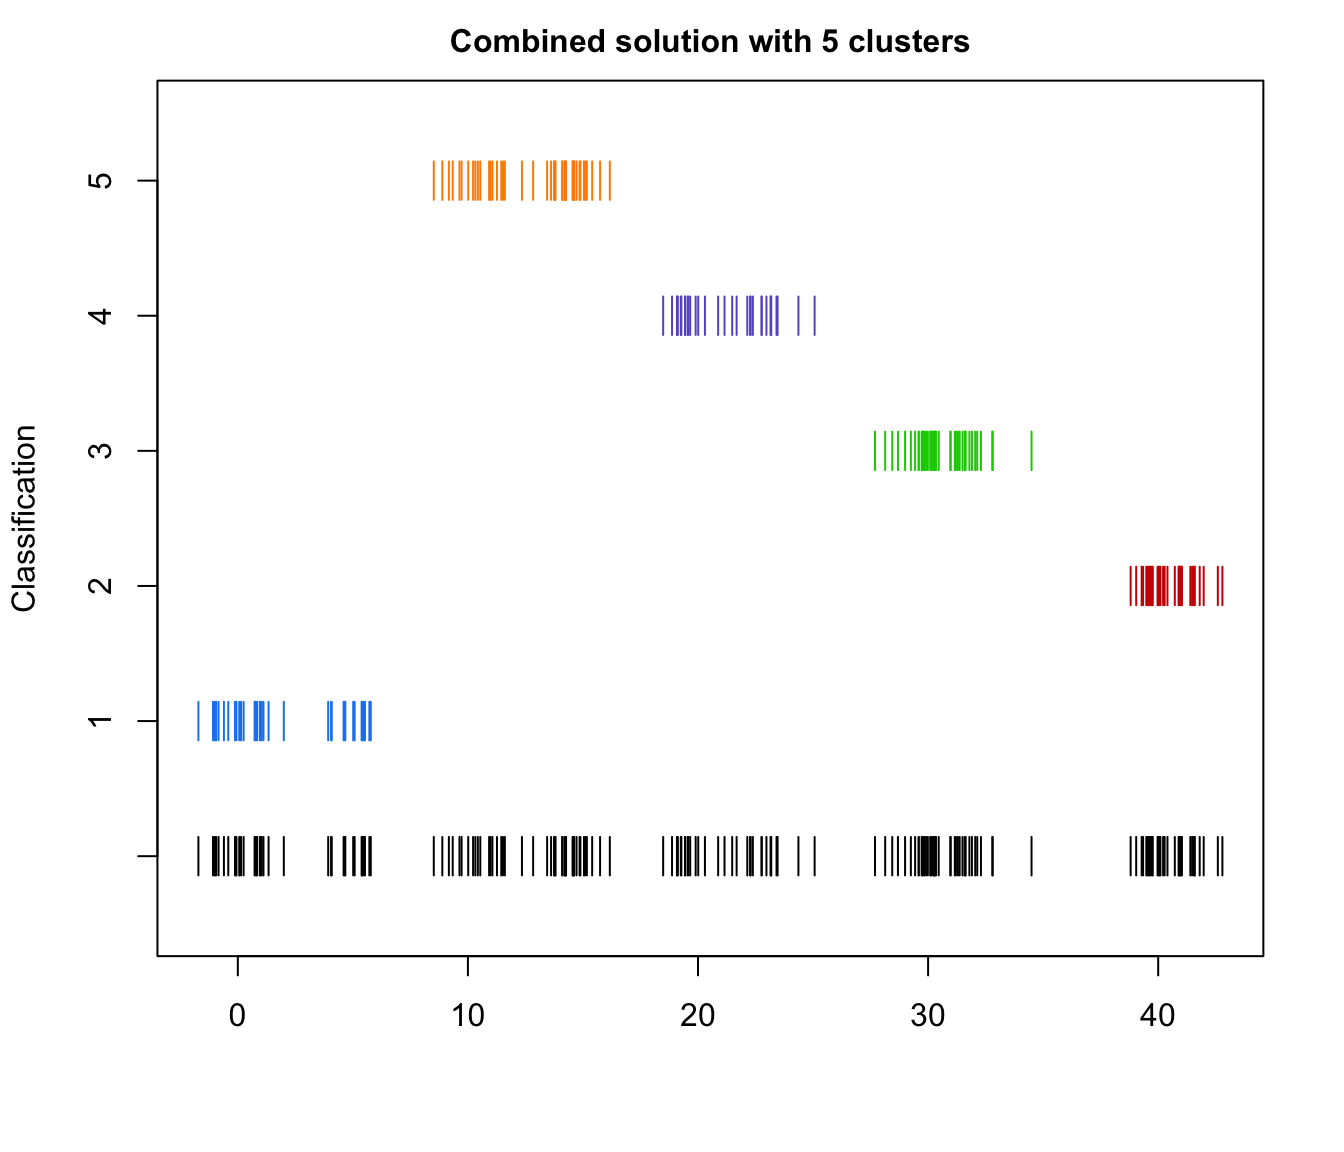
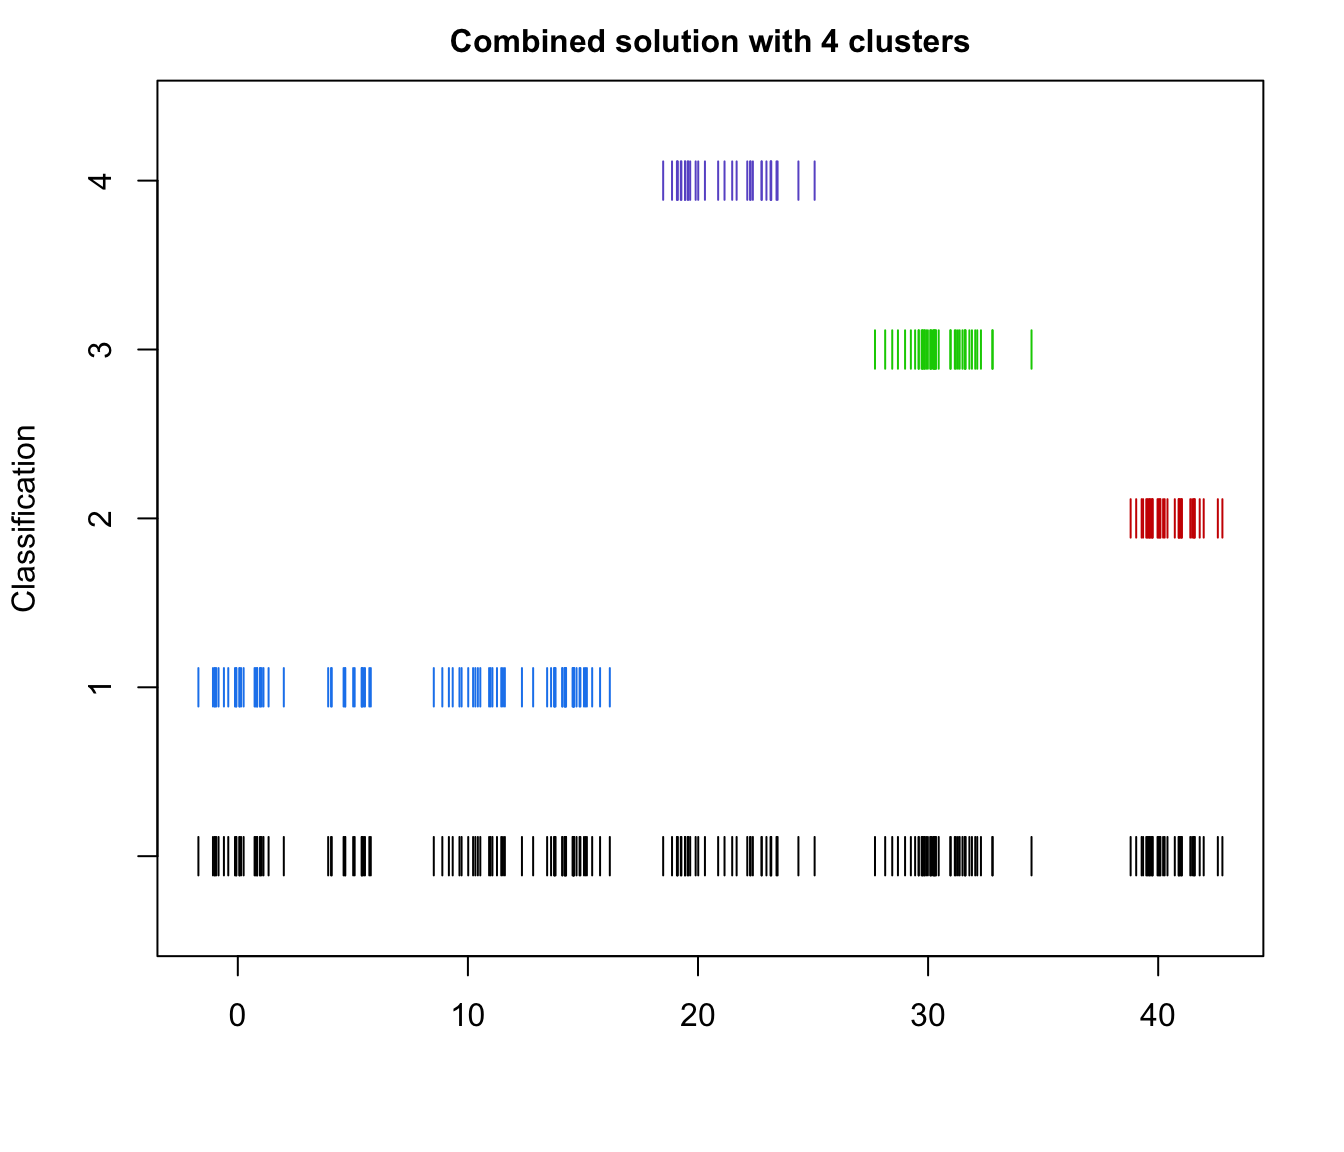
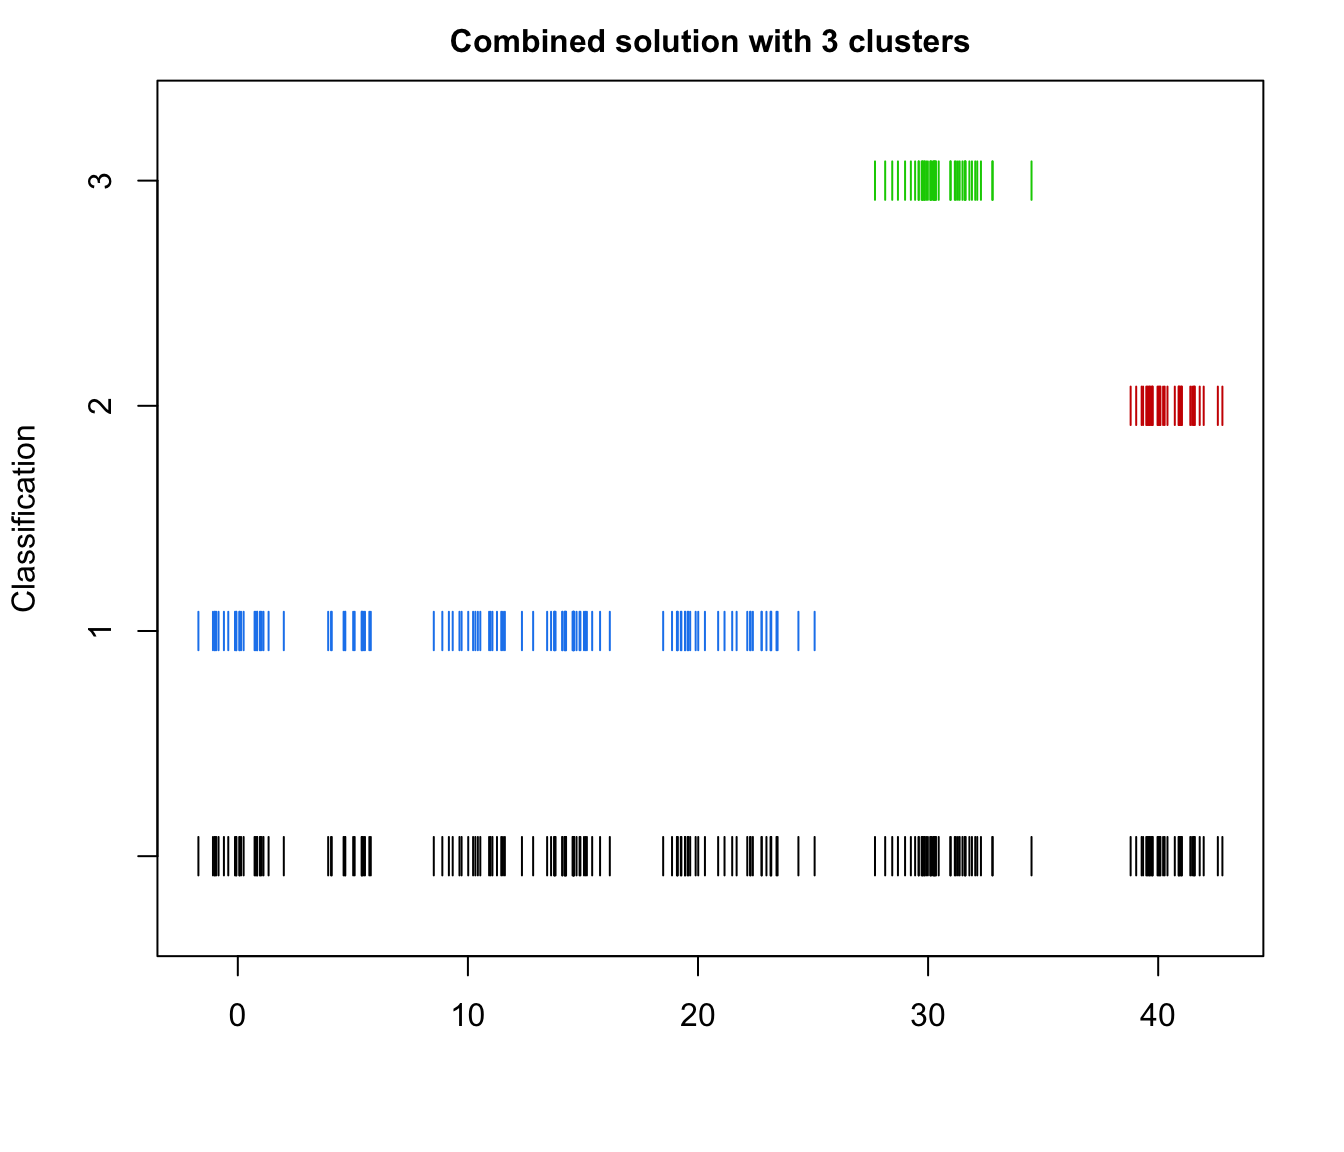
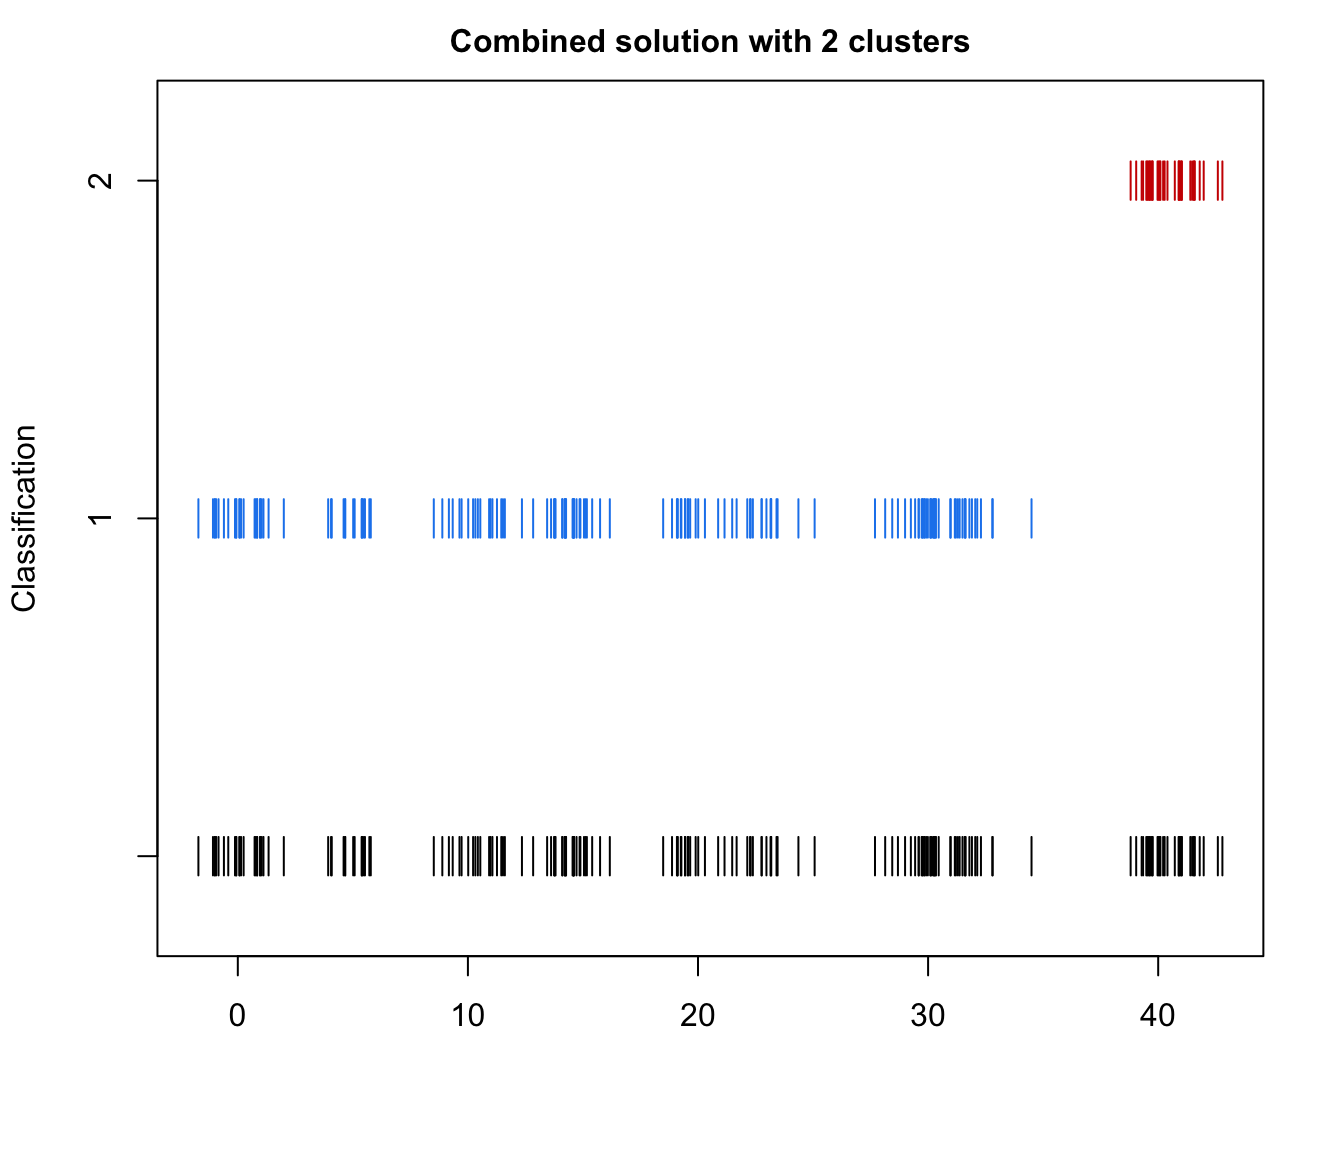
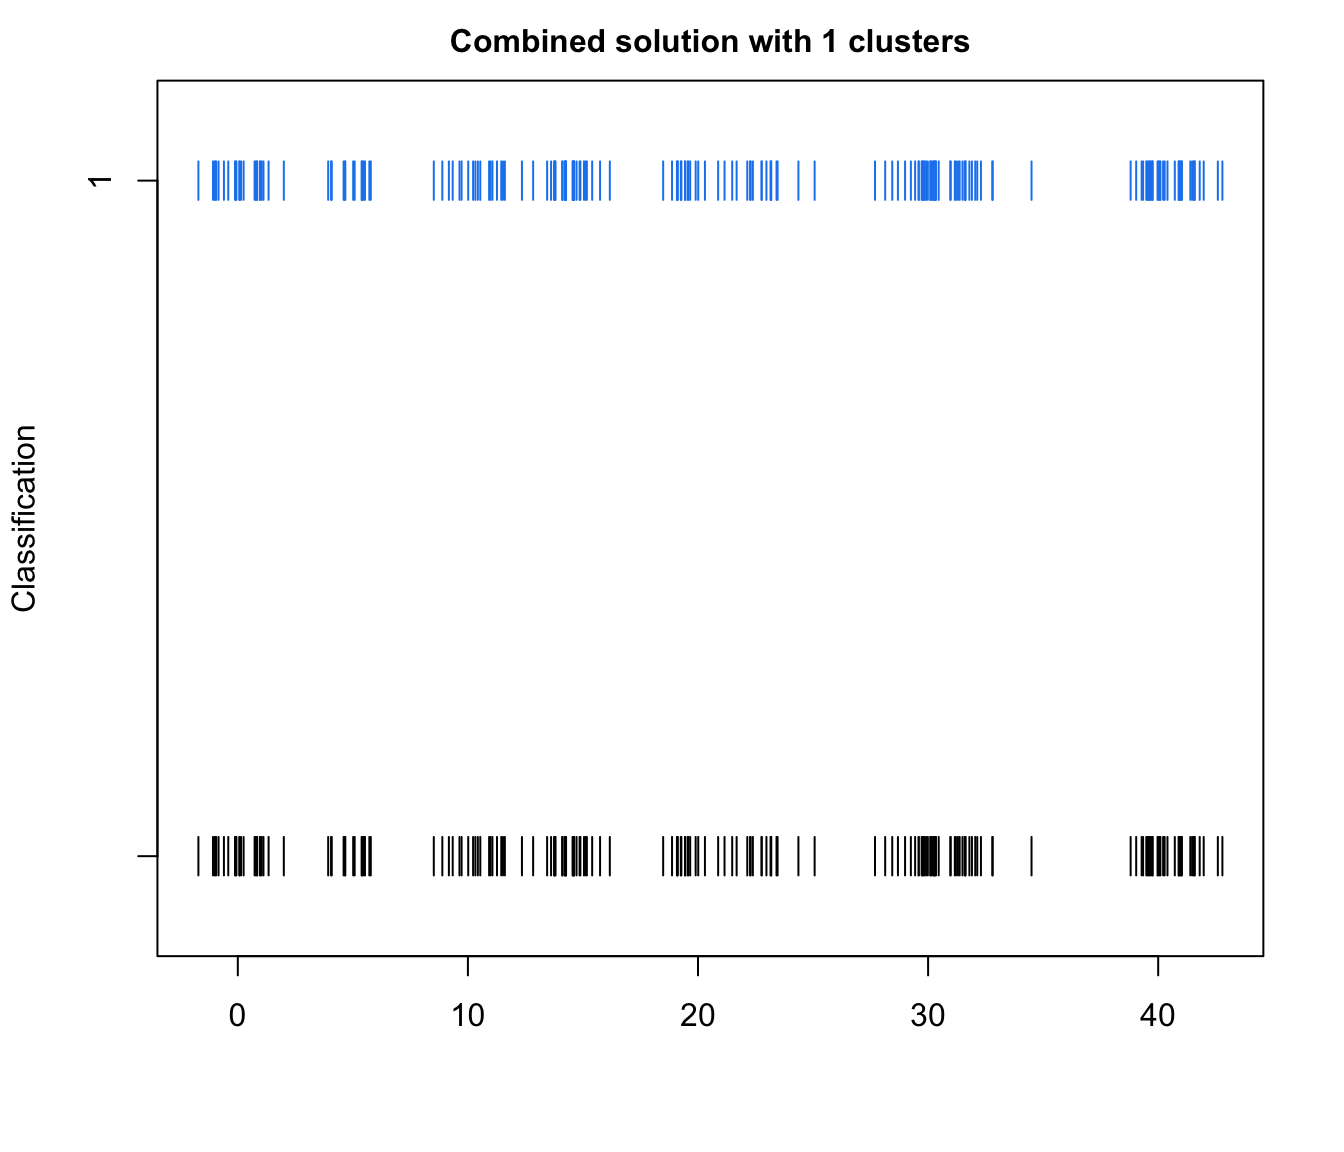
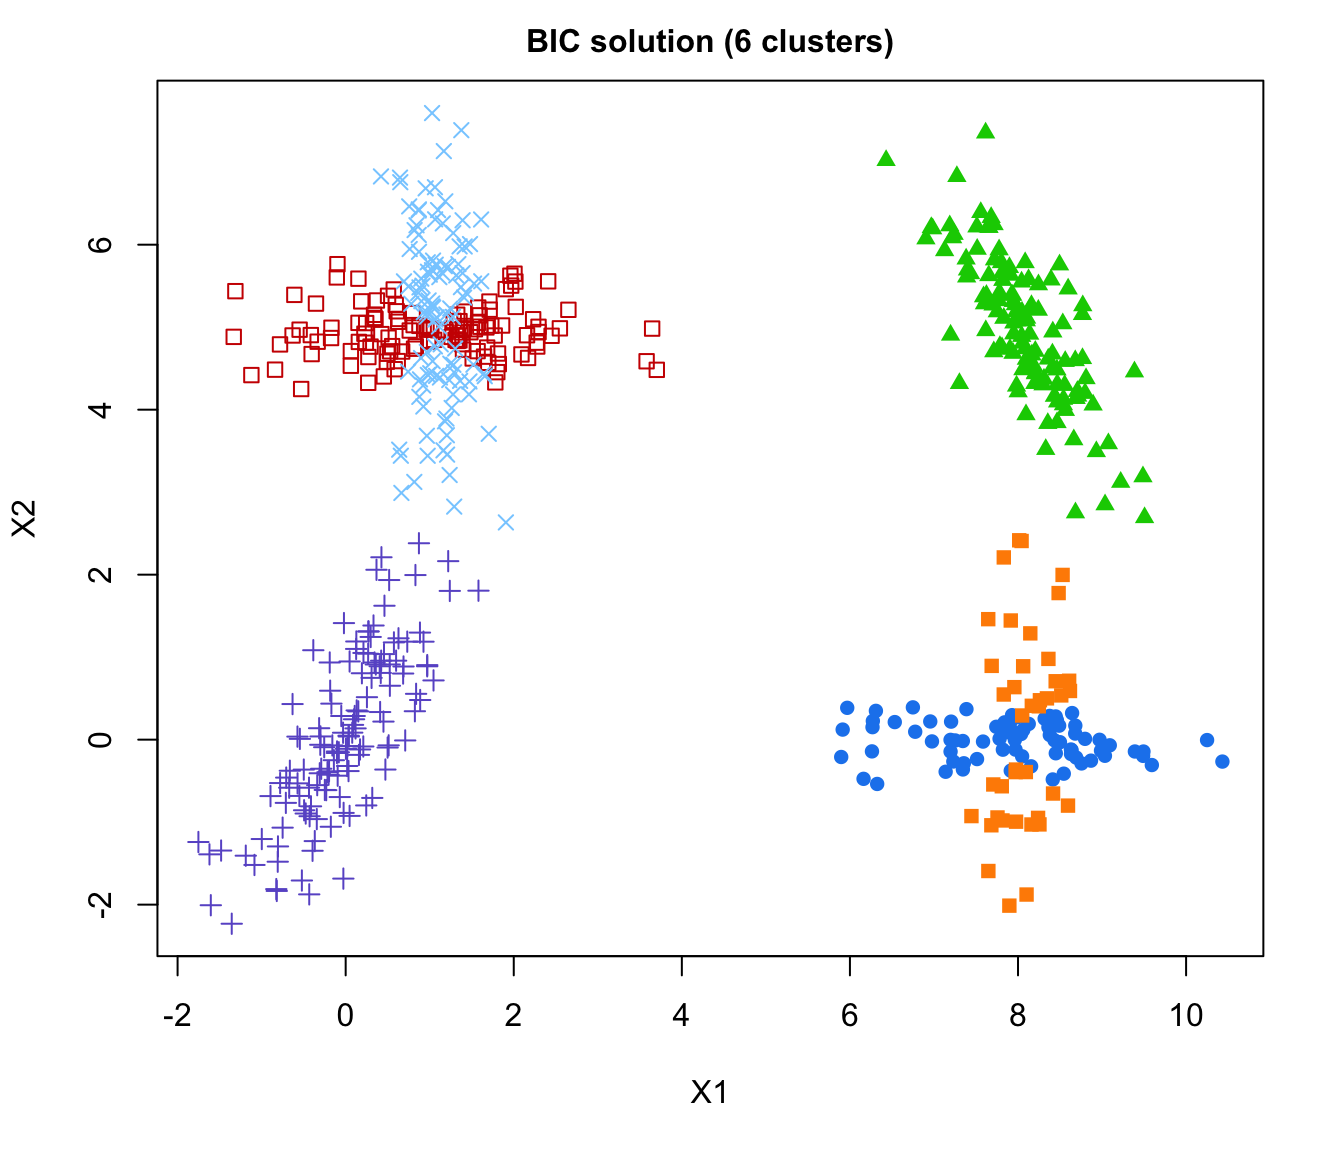
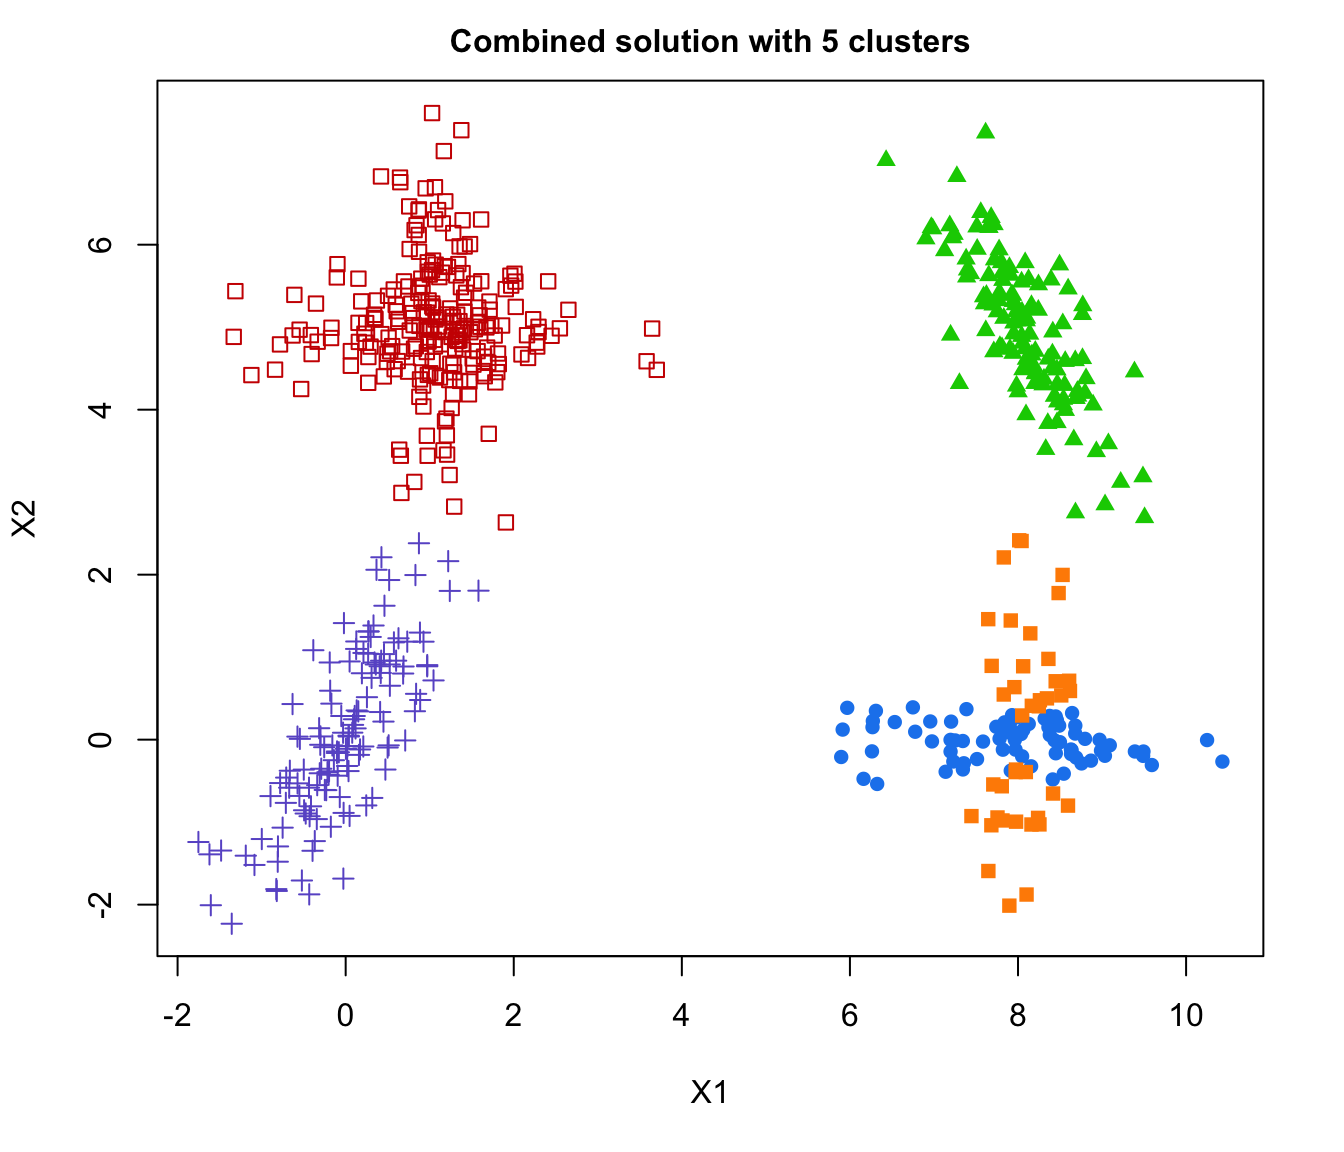
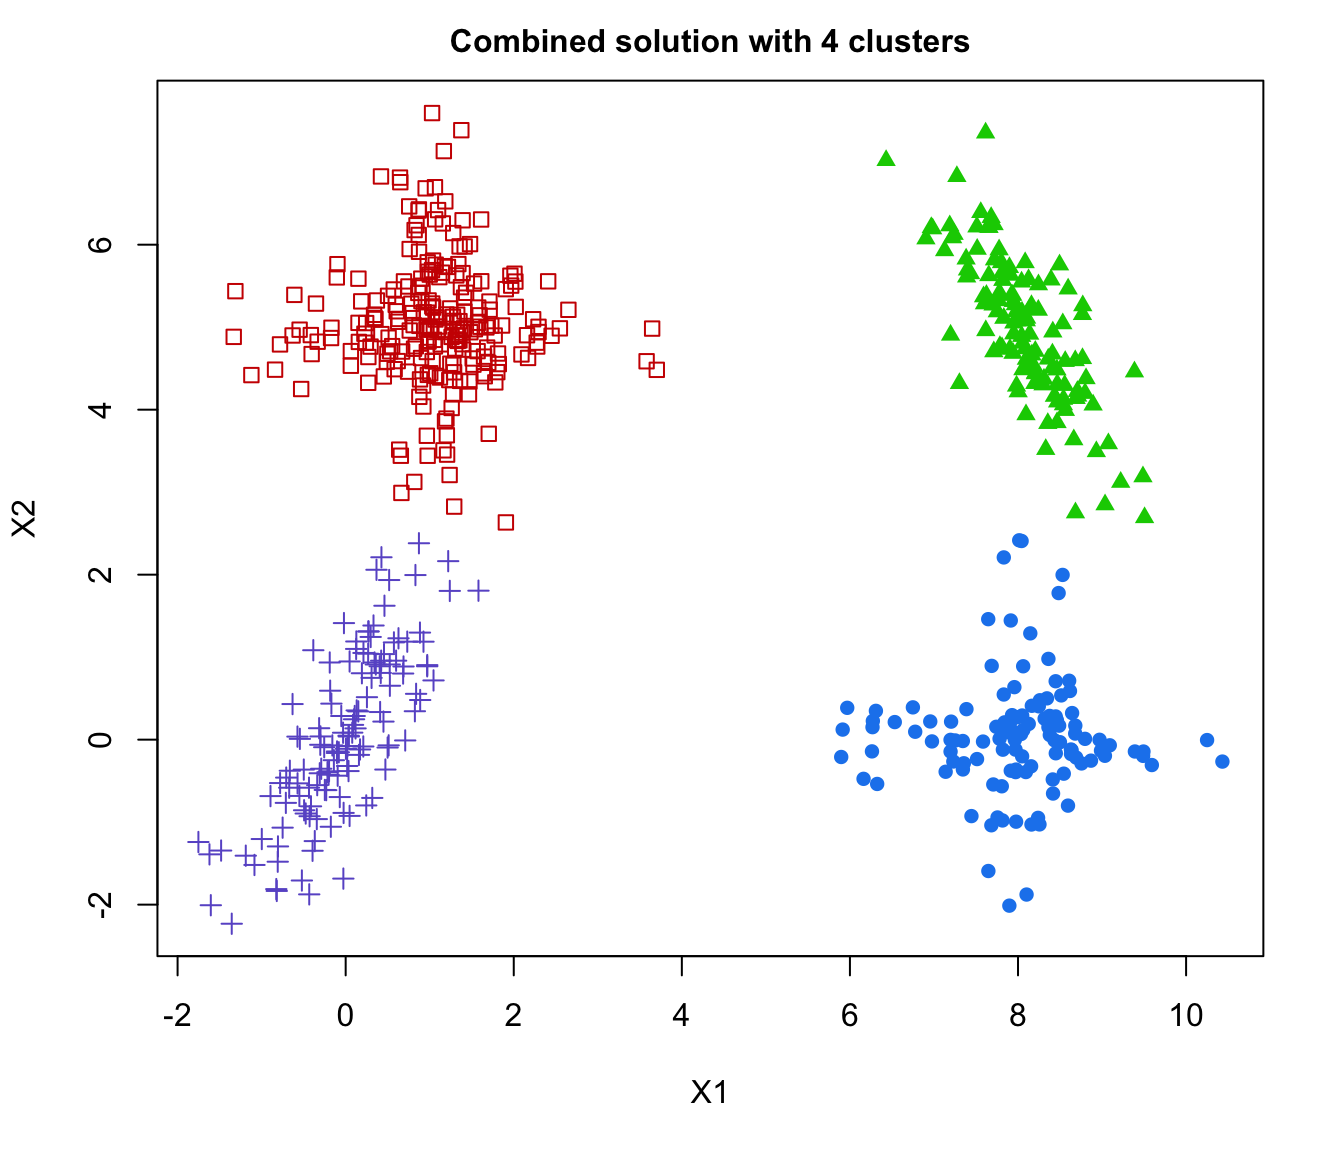
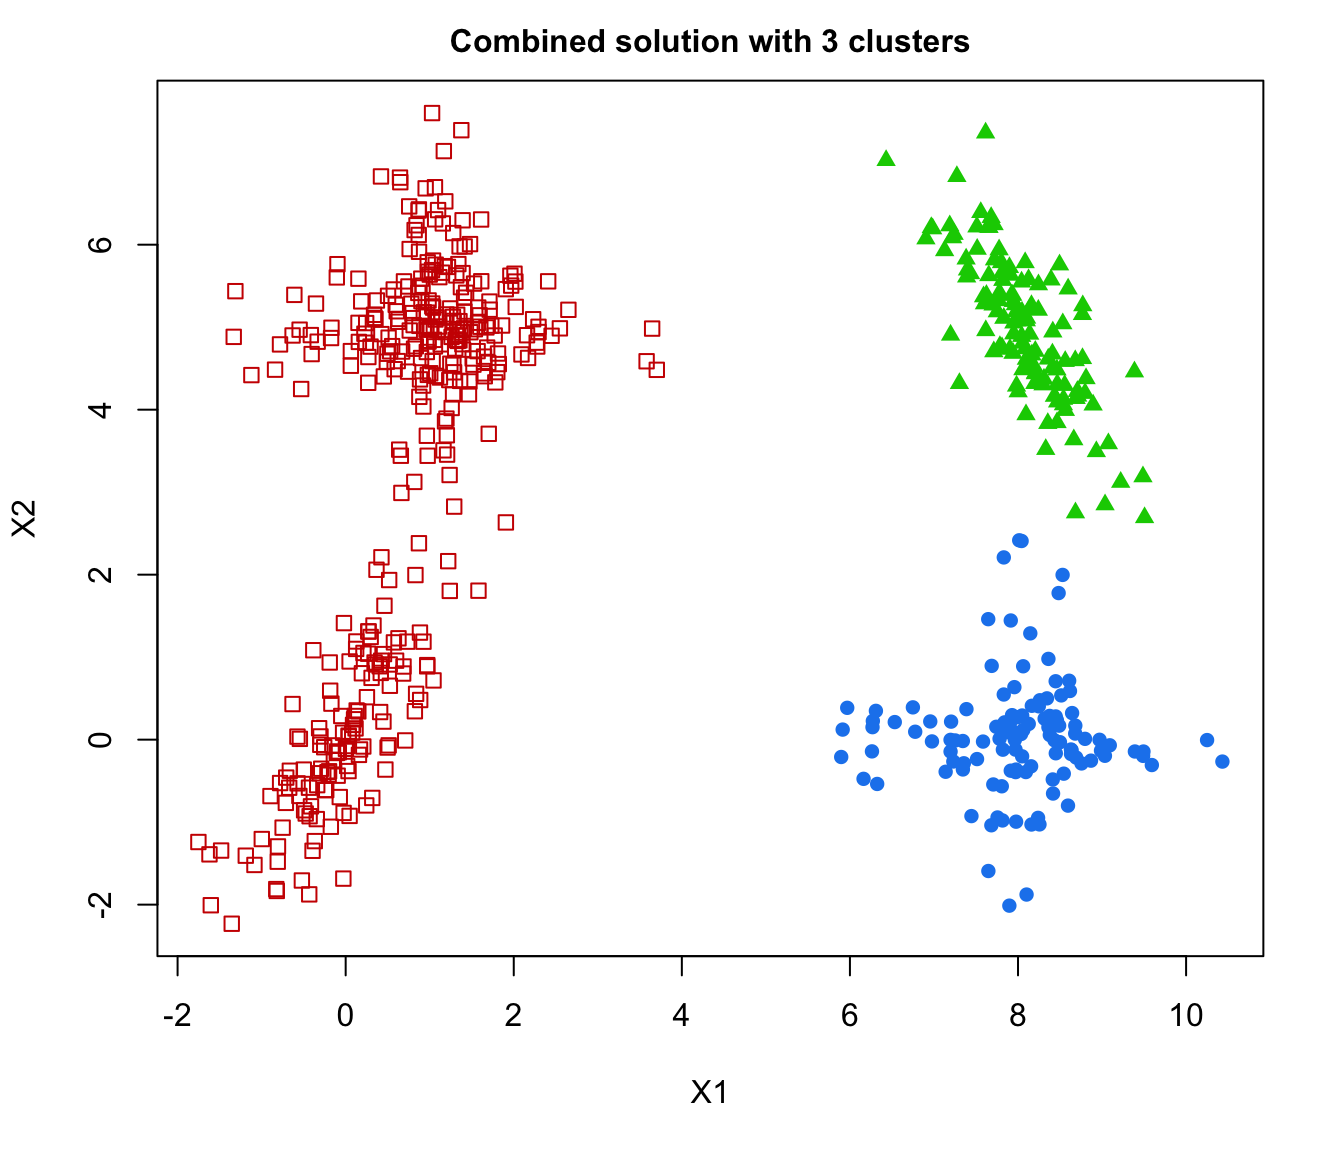
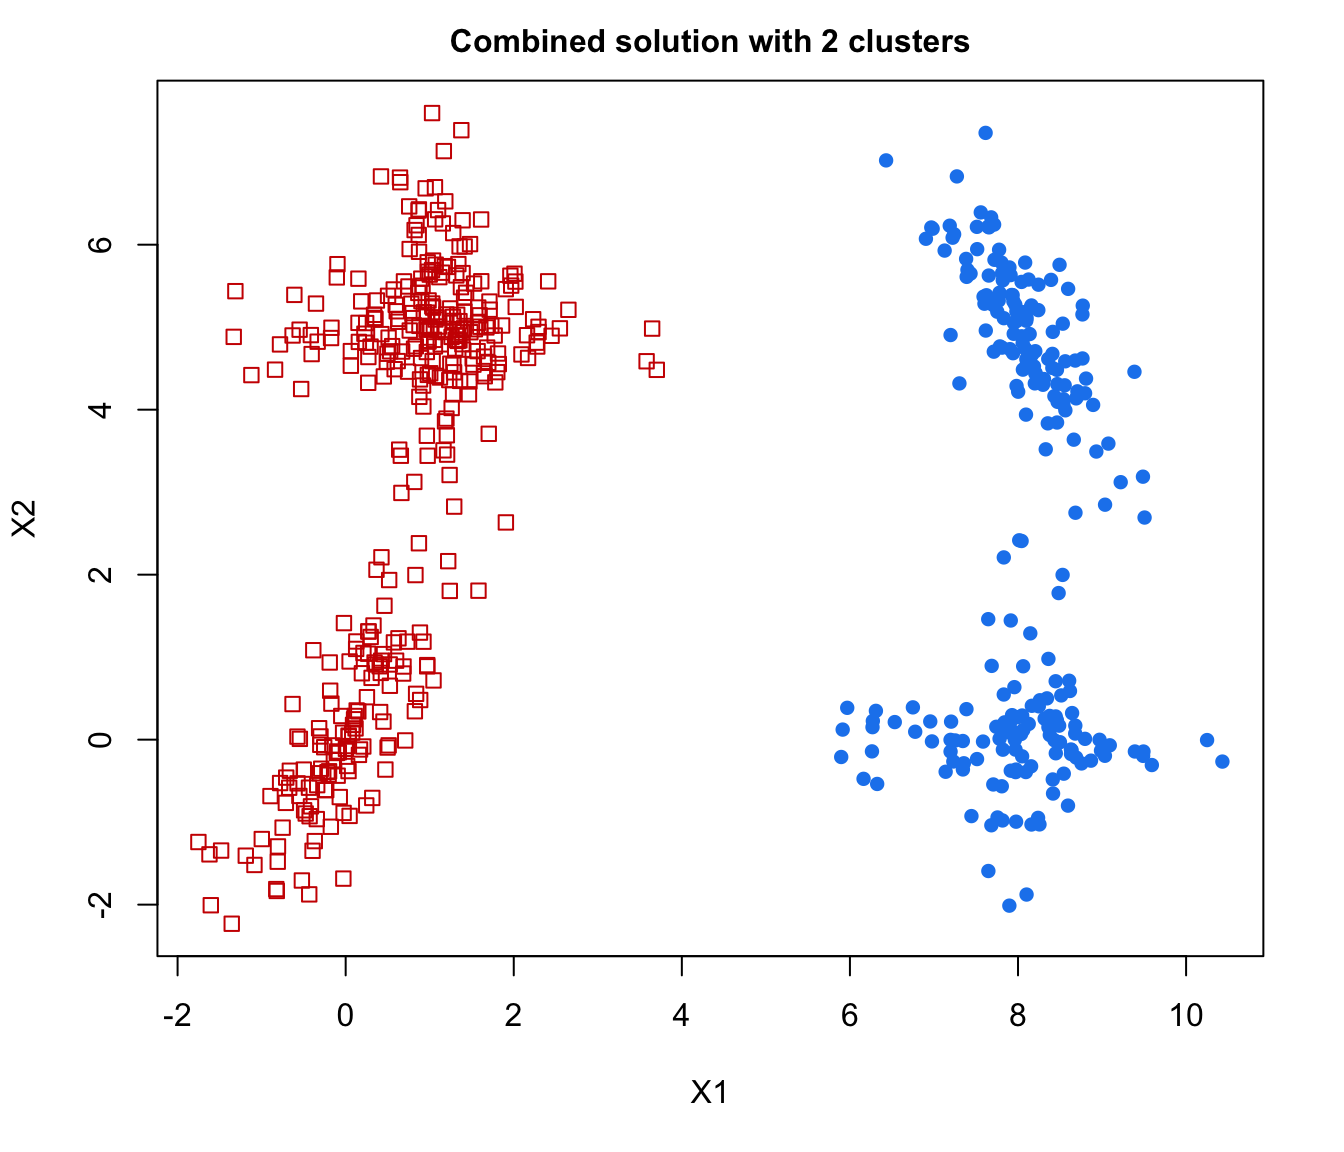
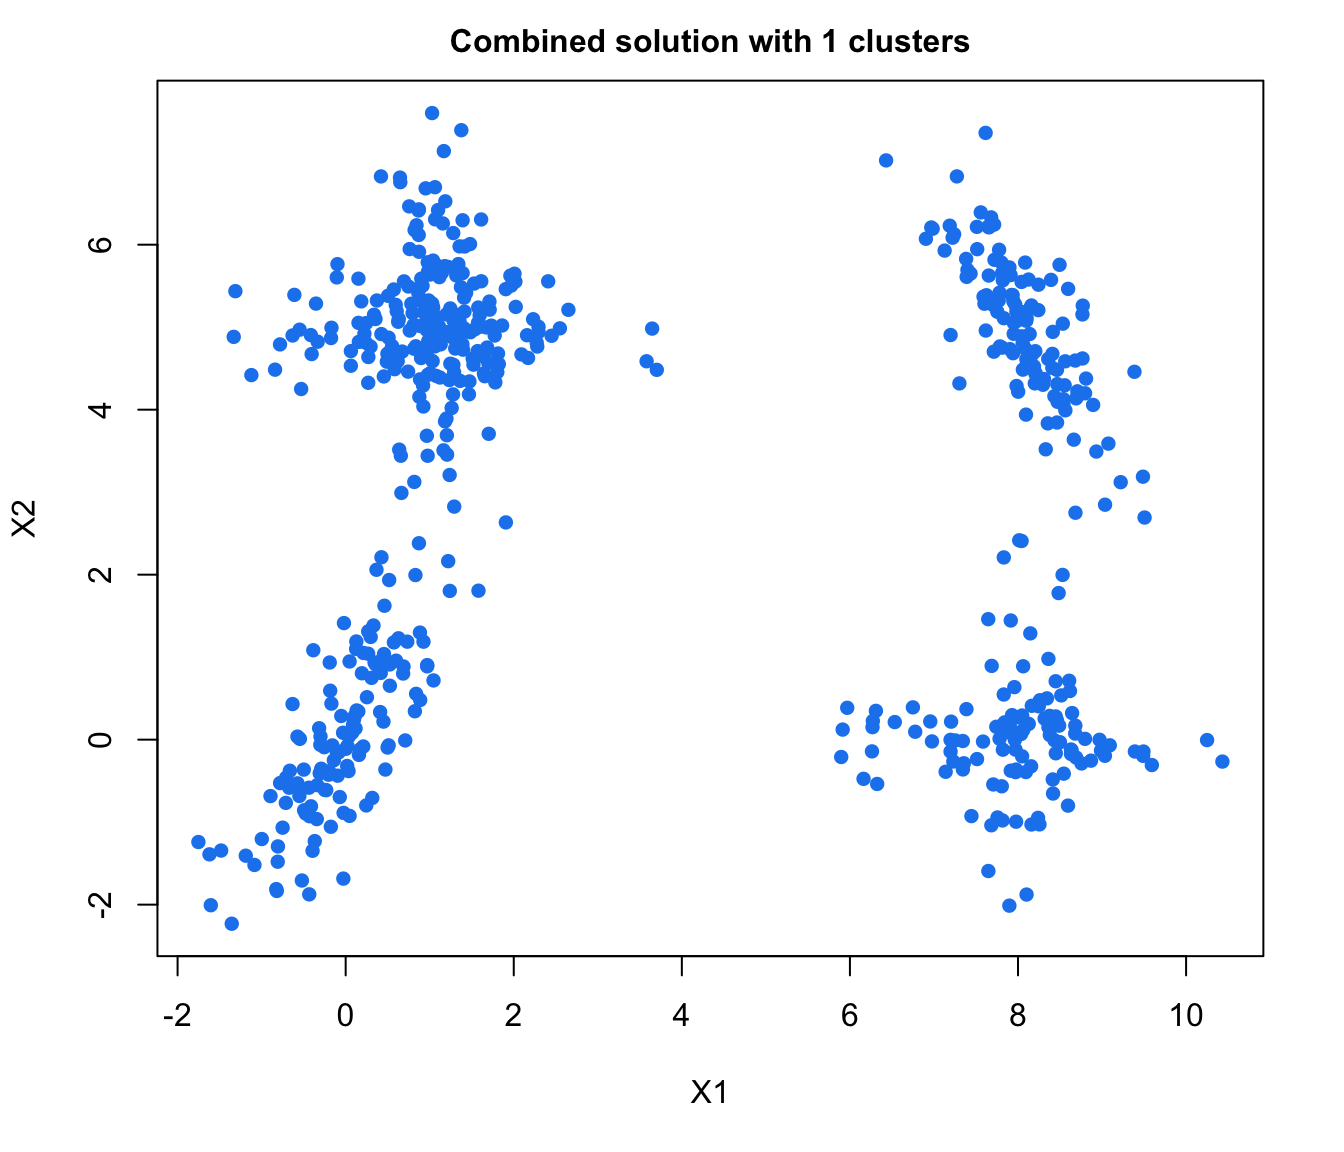
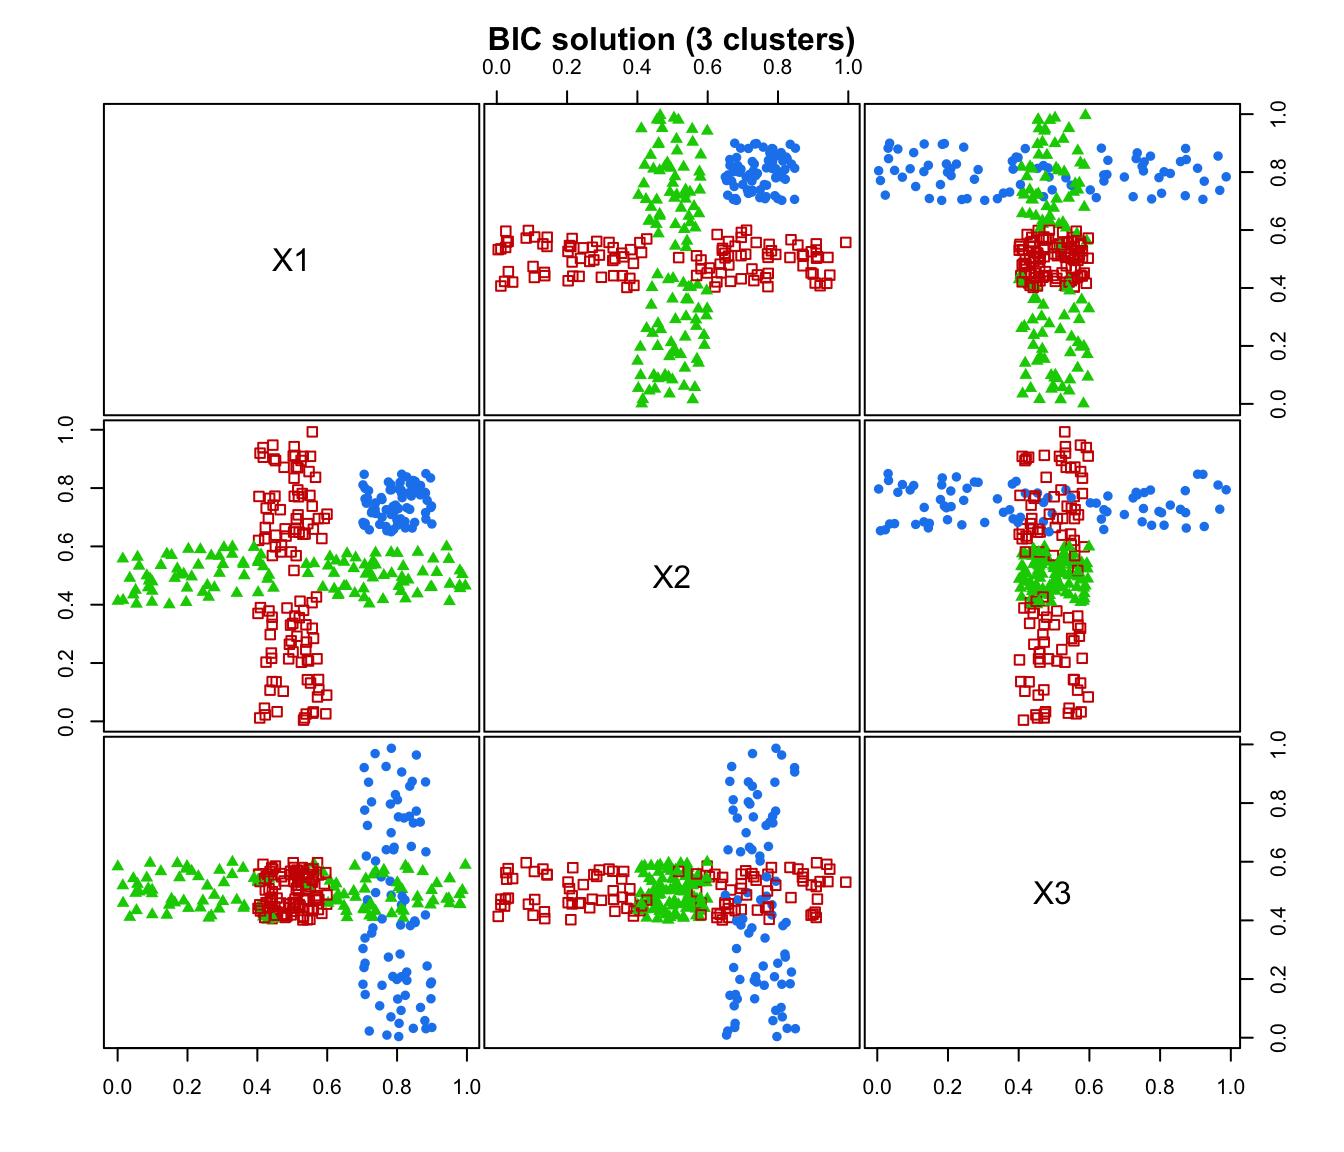
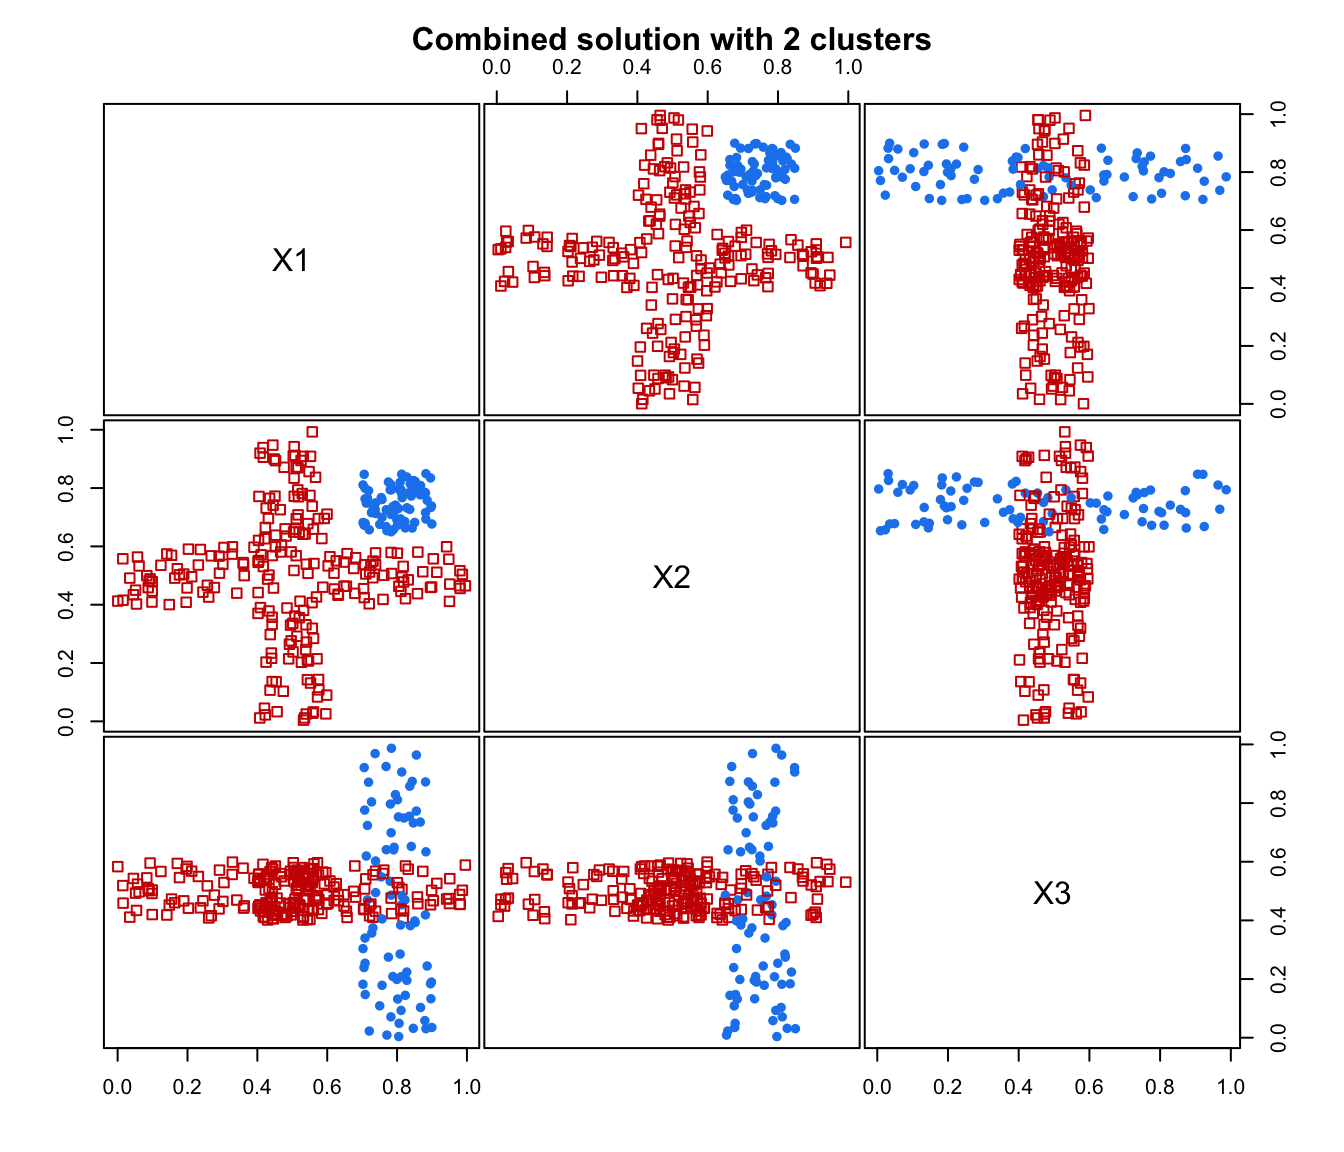
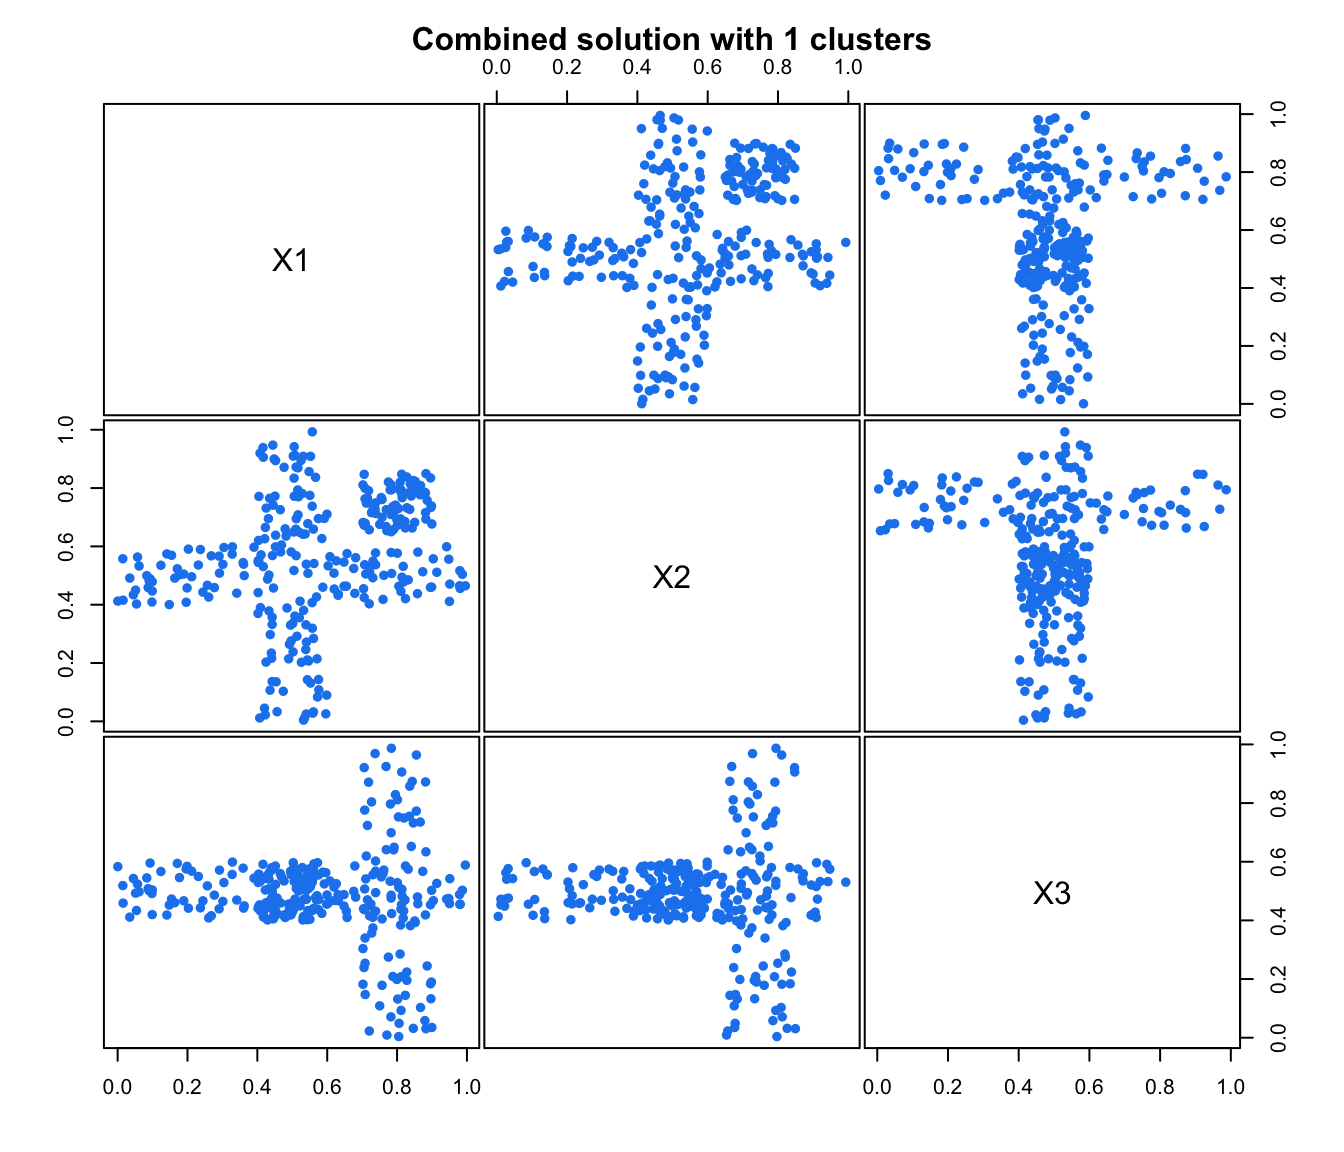
Classifications are plotted with combiPlot, which relies on the Mclust plot functions.
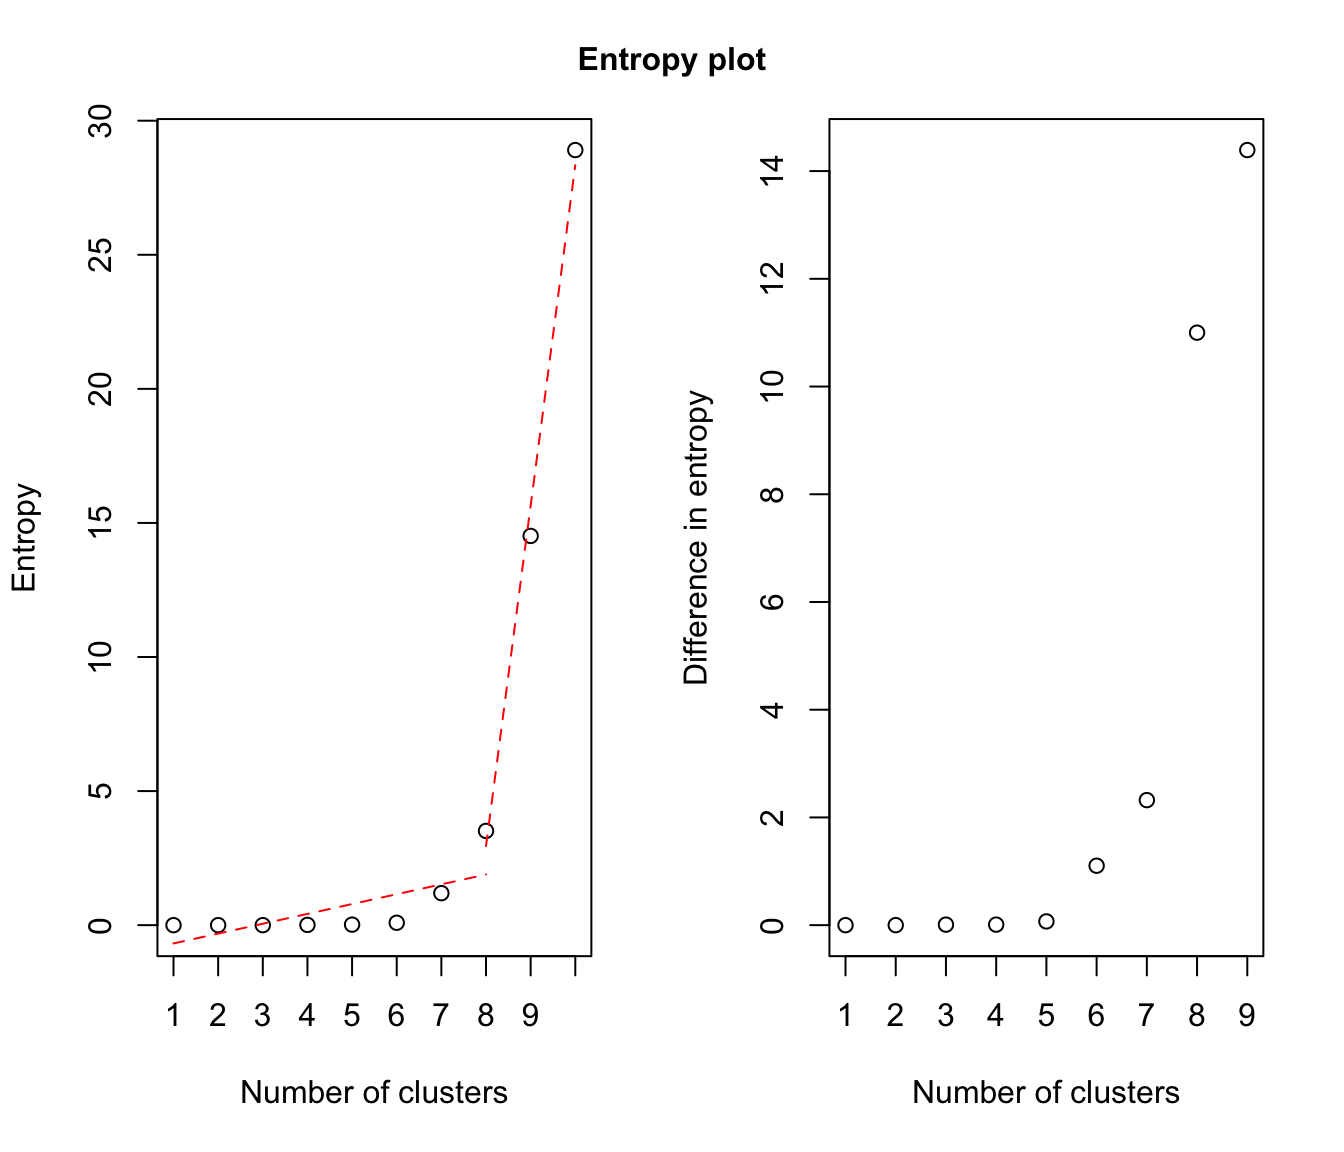
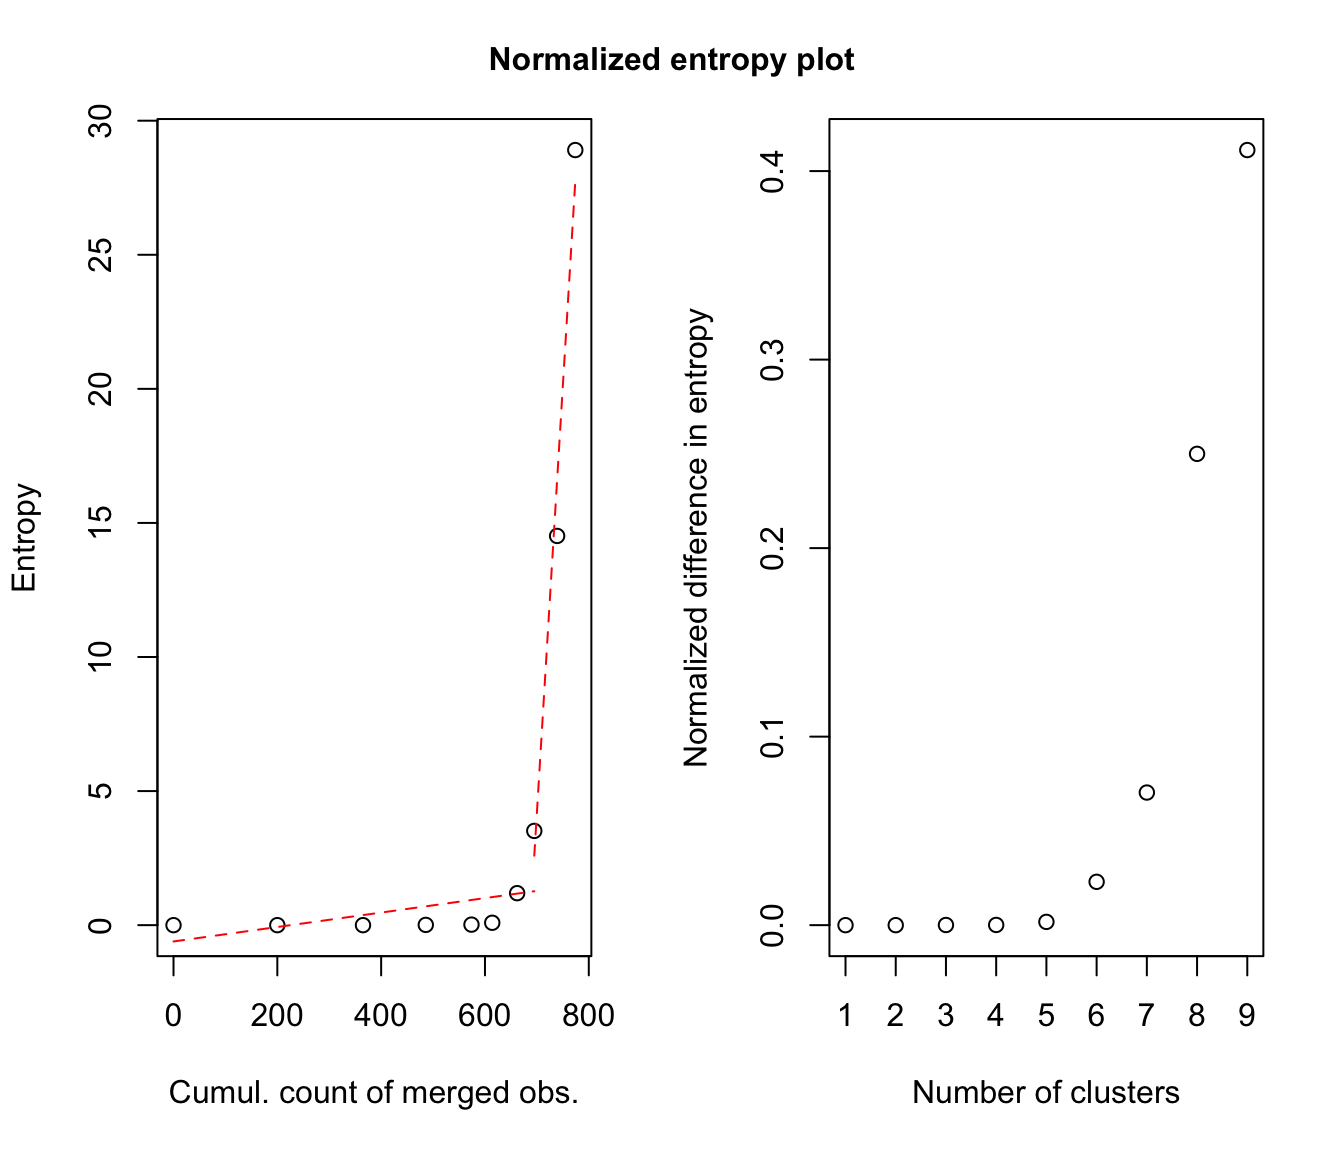
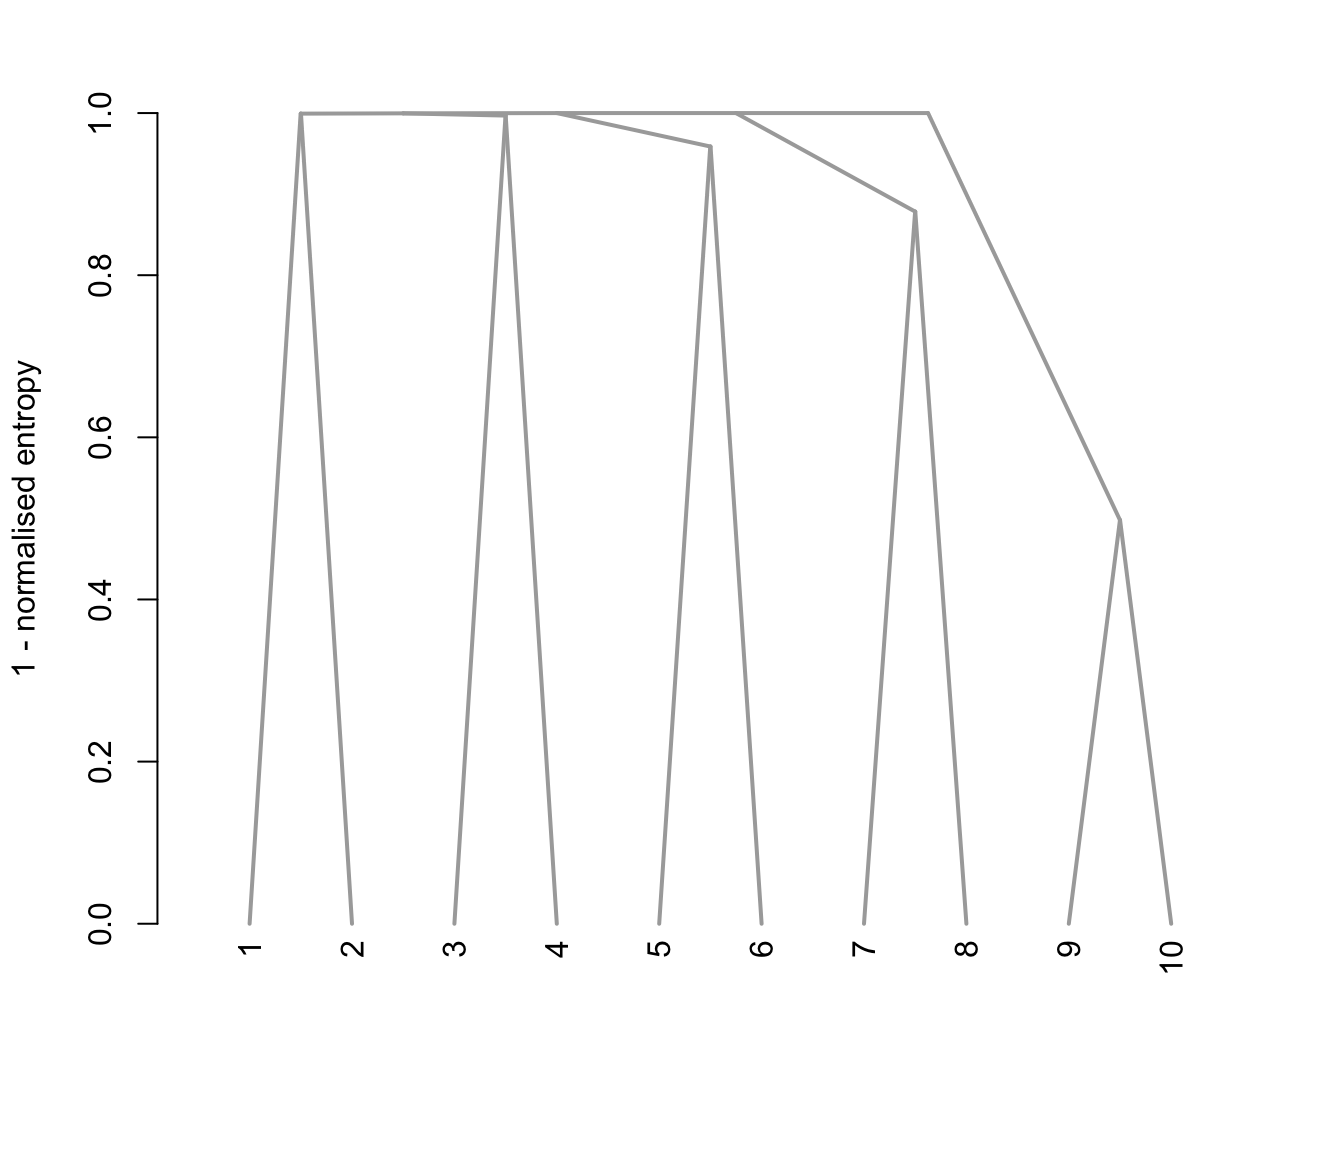
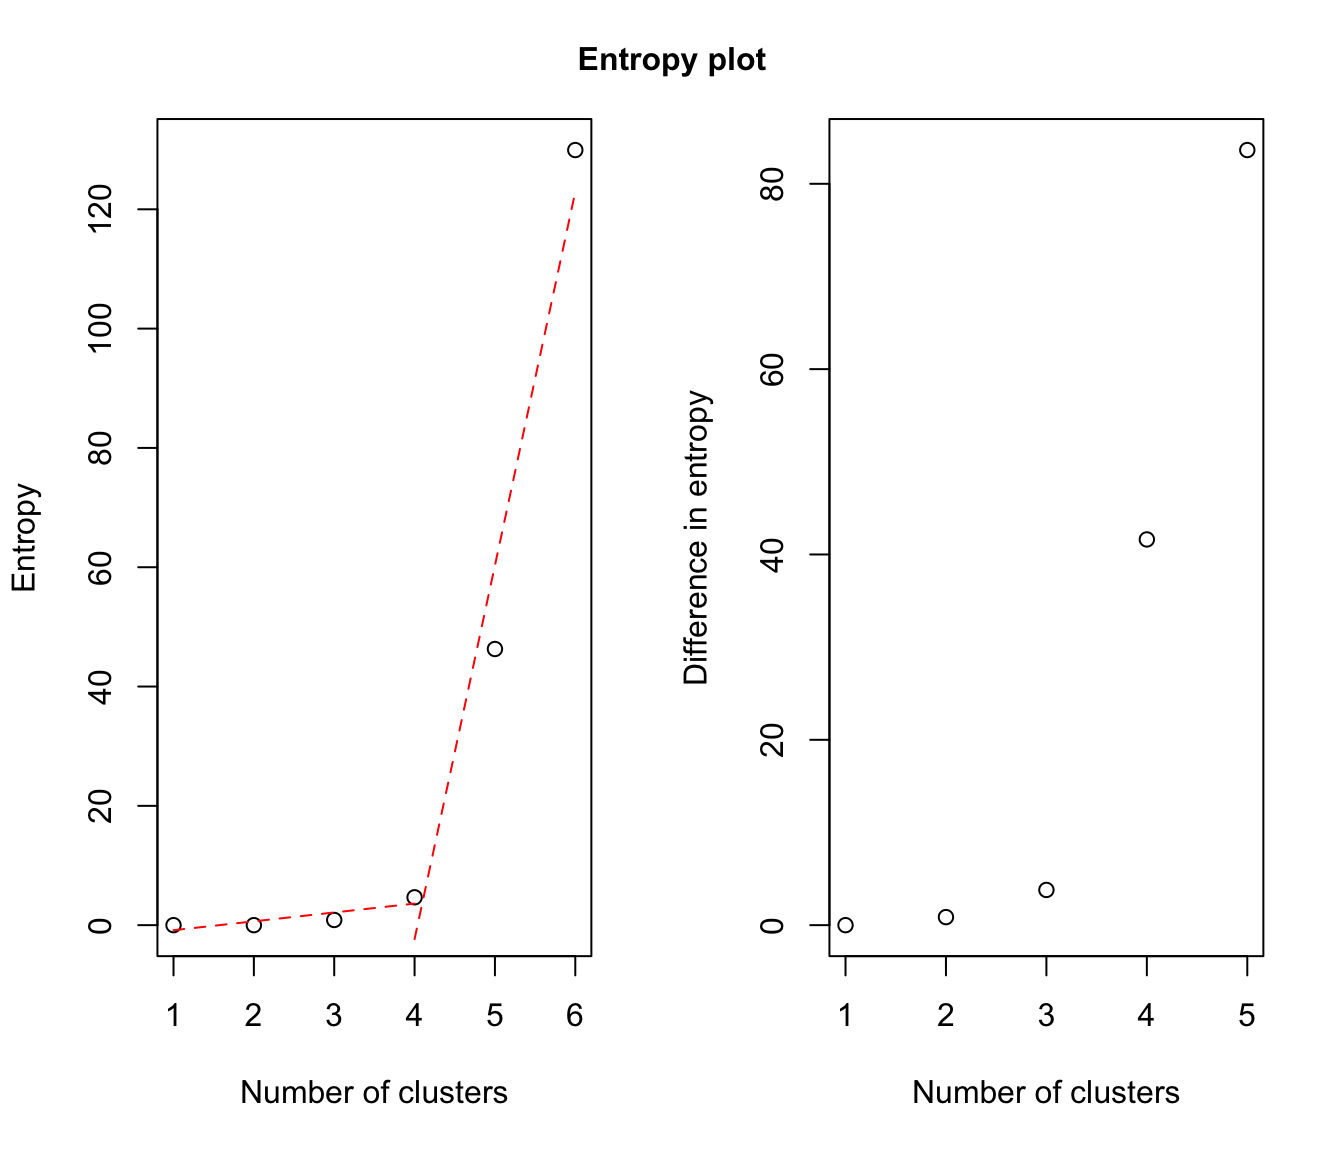
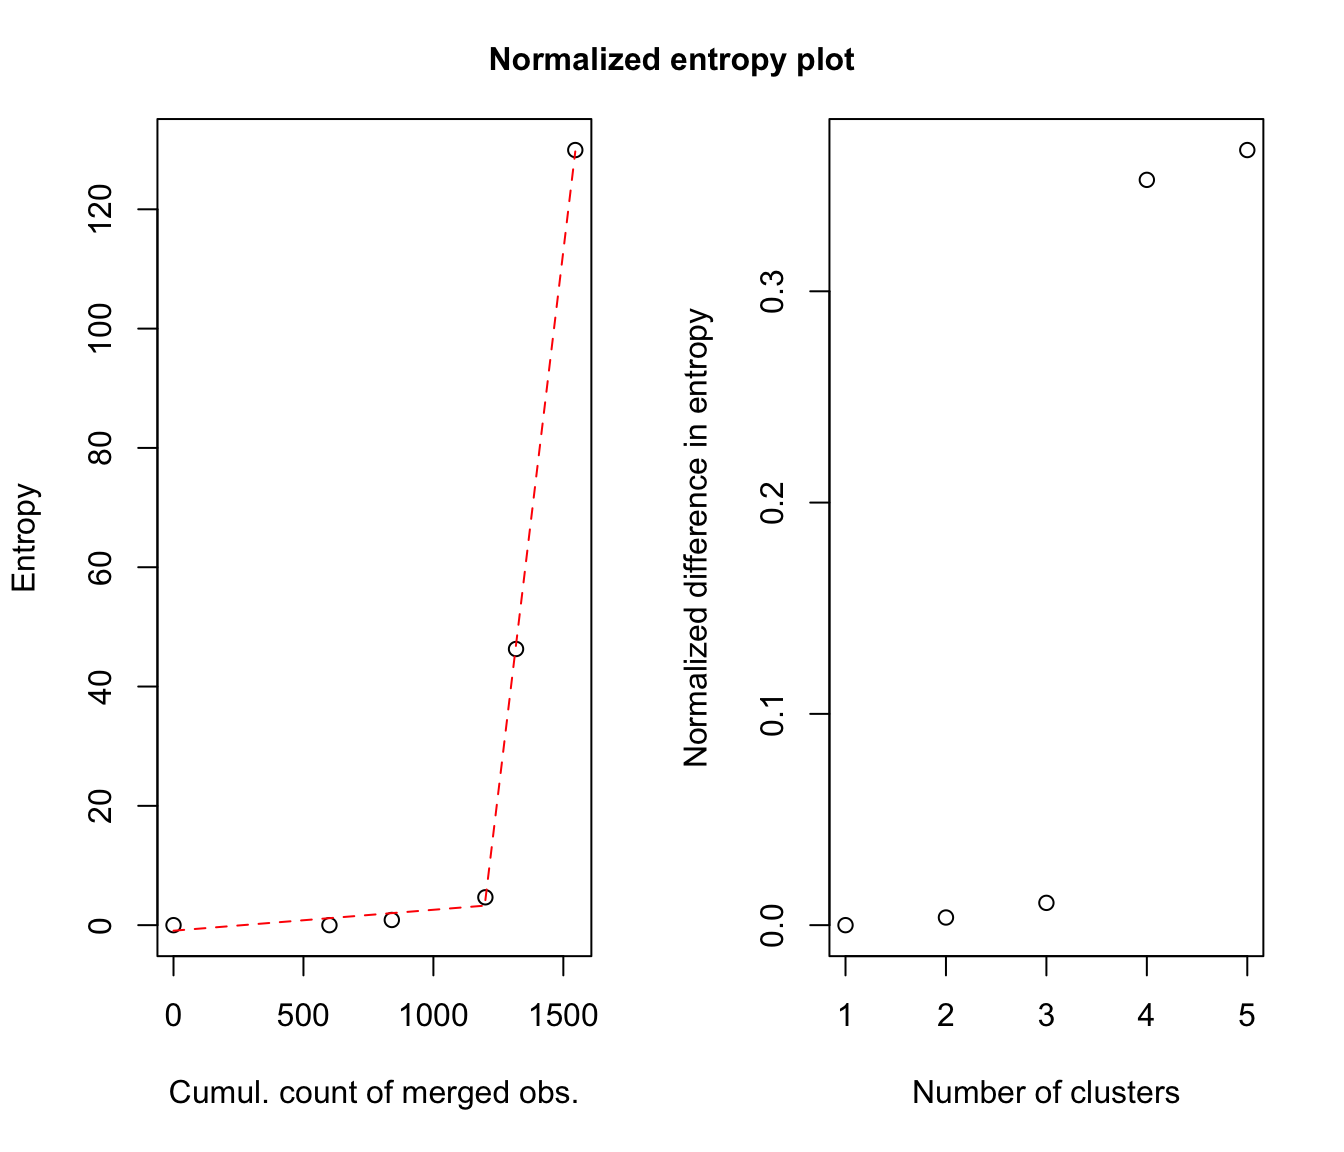
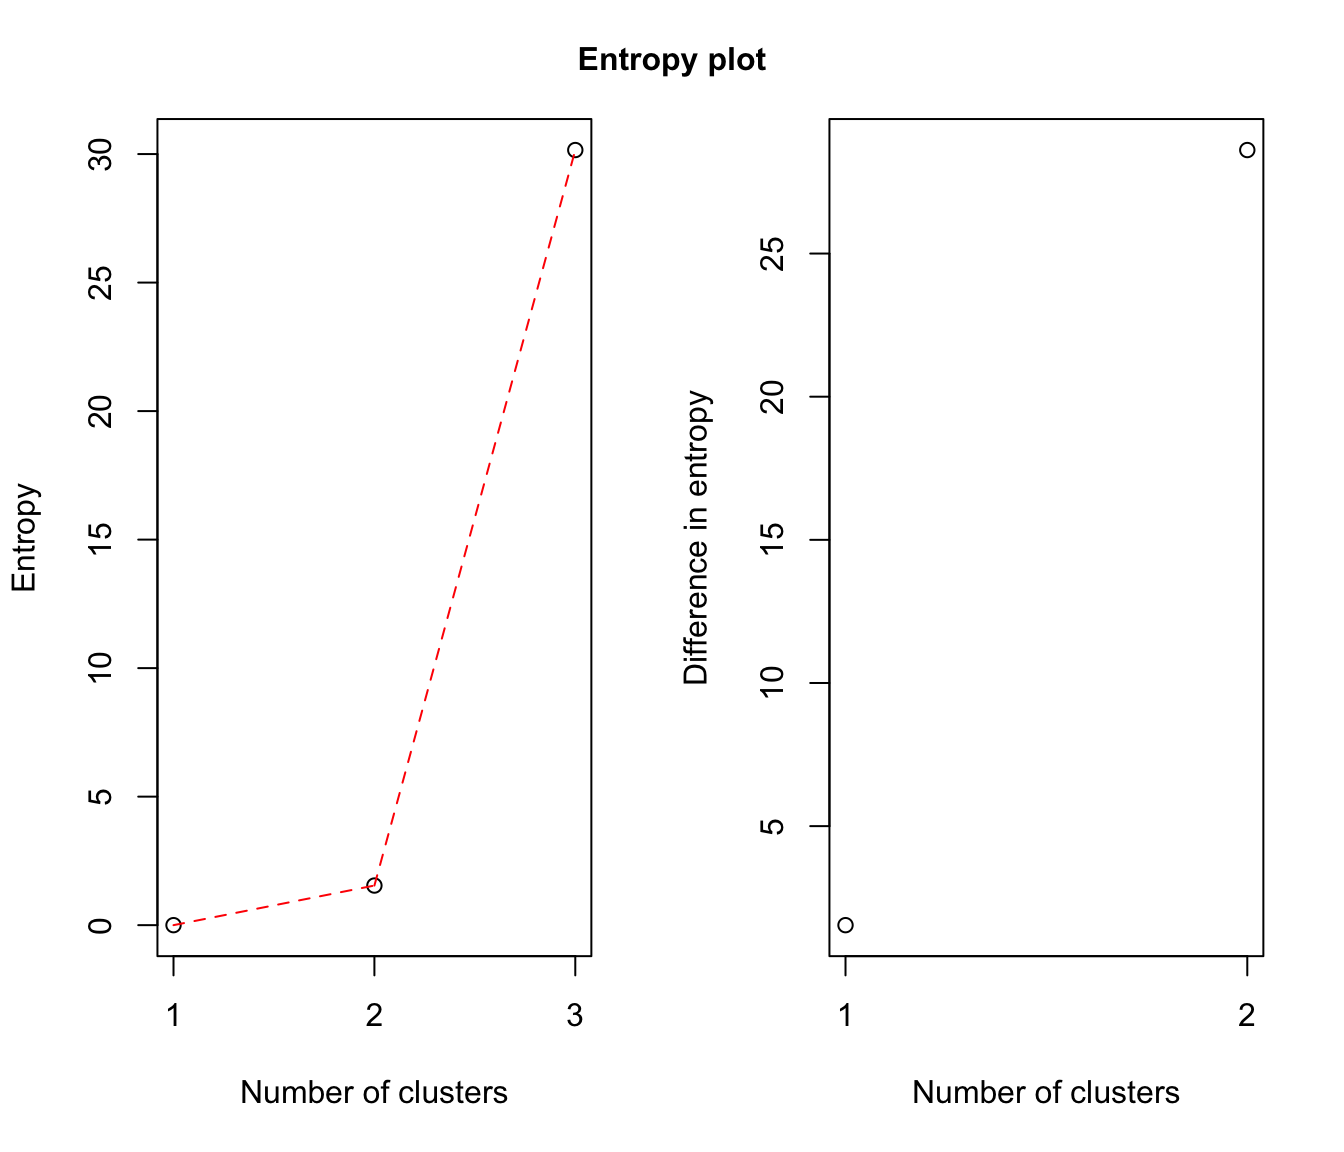
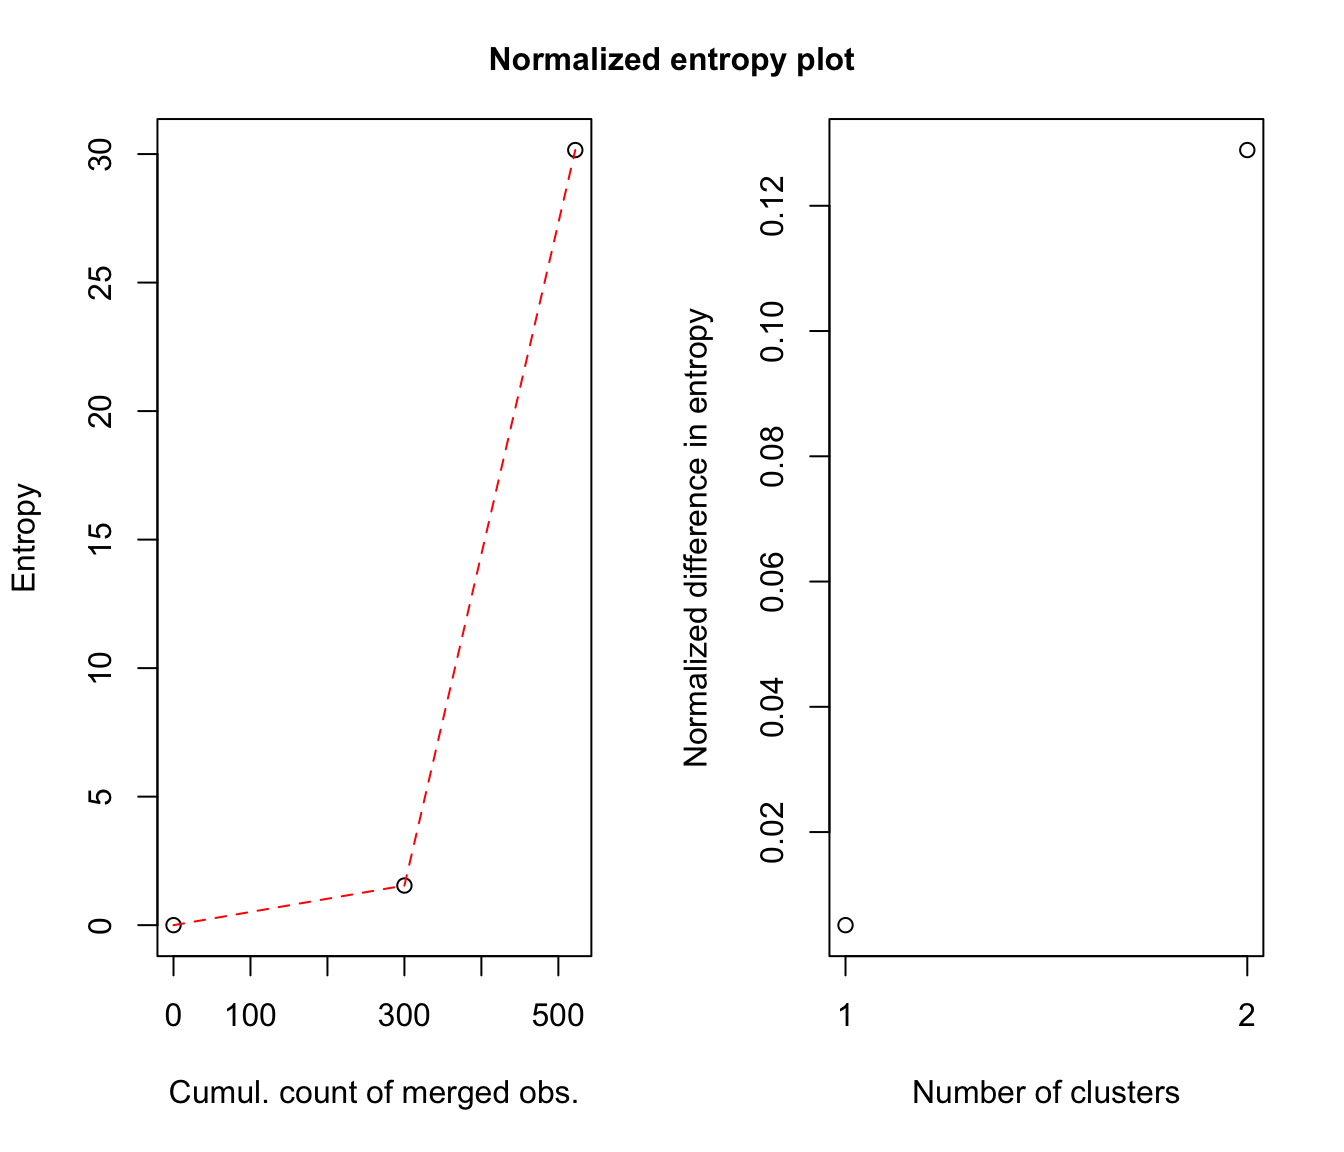
Entropy plots are plotted with entPlot and may help to select a number of classes: please see the article cited in the references.
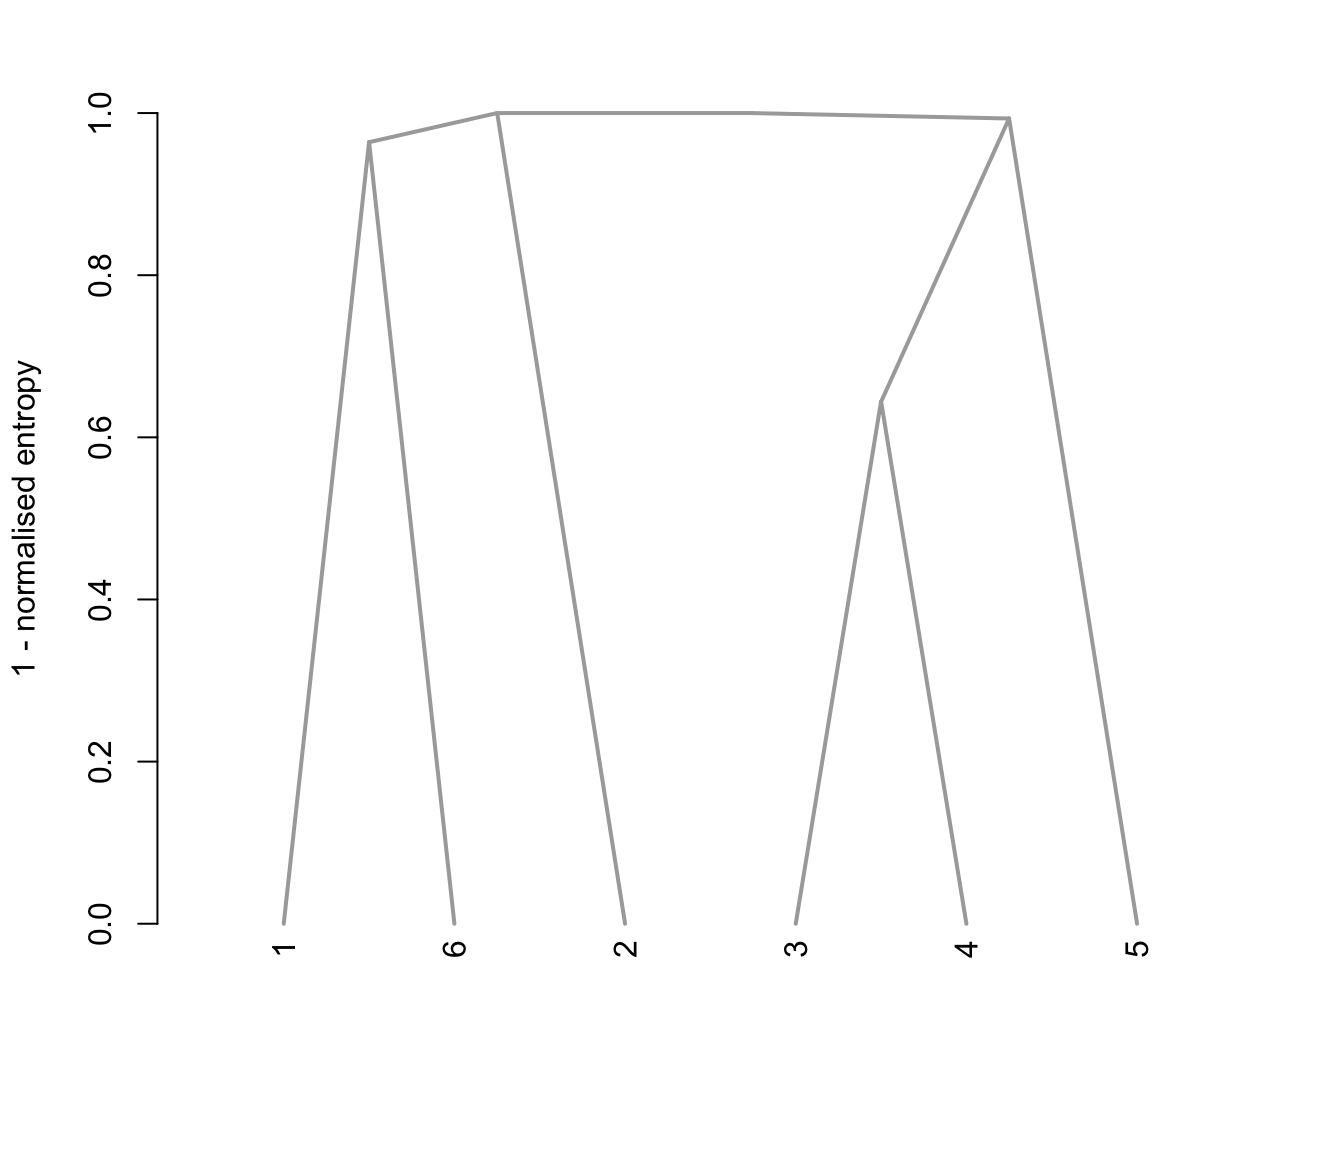
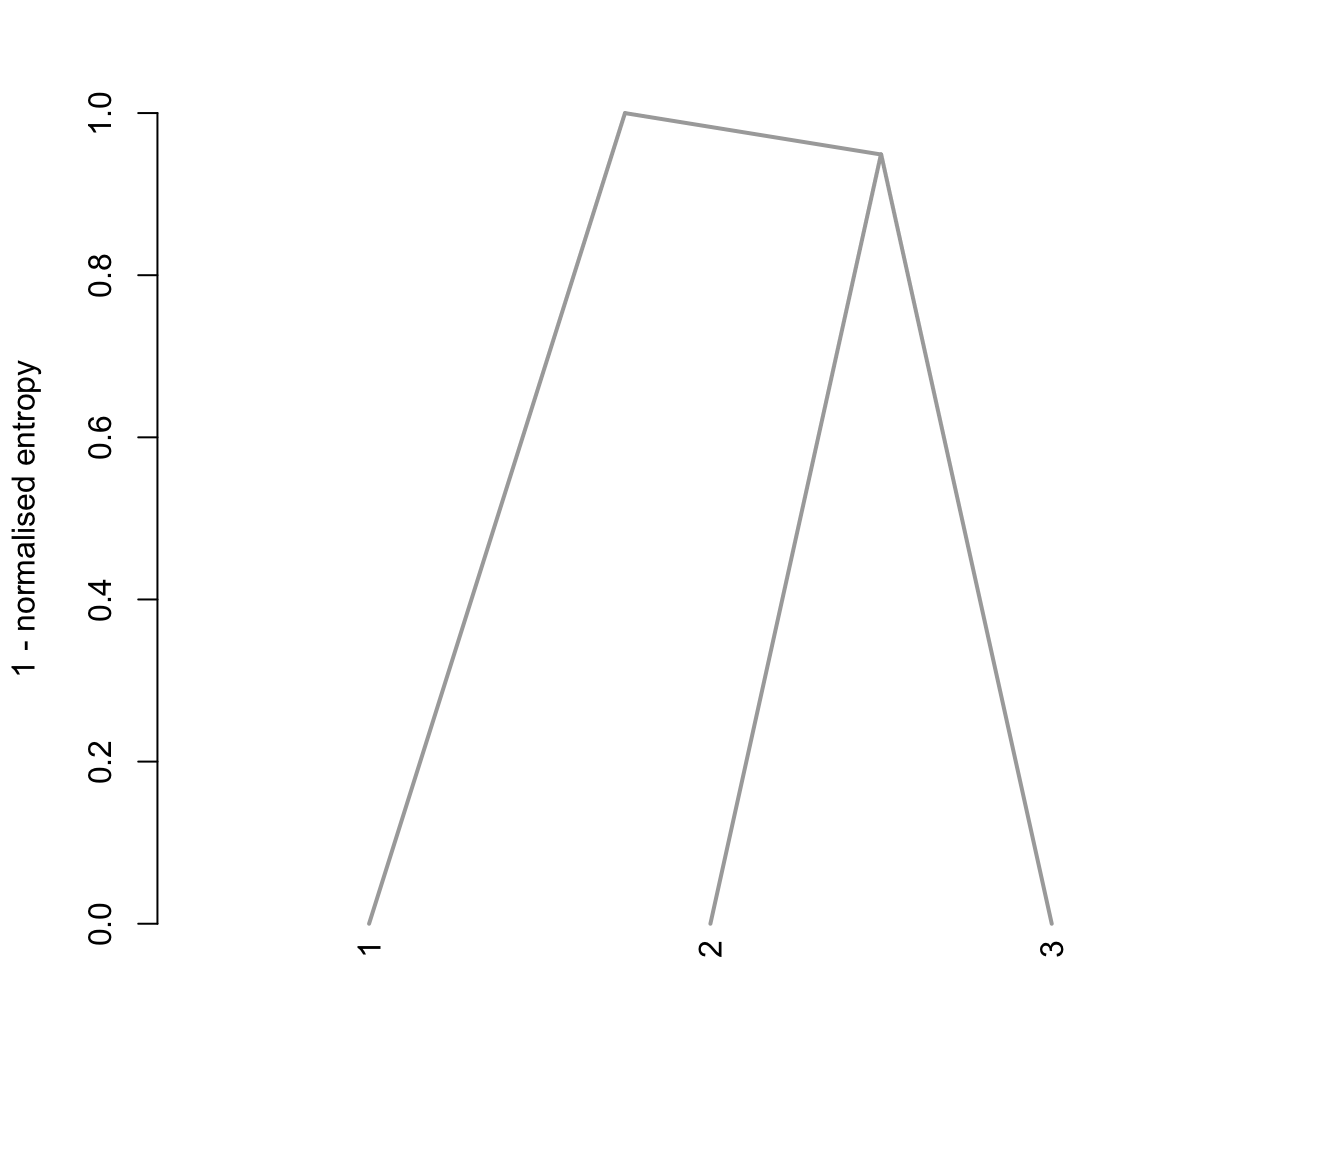
Tree plots are produced by combiTree and graph the tree structure implied by the clusters combining process.
References
J.-P. Baudry, A. E. Raftery, G. Celeux, K. Lo and R. Gottardo (2010). Combining mixture components for clustering. Journal of Computational and Graphical Statistics, 19(2):332-353.
Examples
# \donttest{
data(Baudry_etal_2010_JCGS_examples)
## 1D Example
output <- clustCombi(data = Test1D, G=1:15)
# plots the hierarchy of combined solutions, then some "entropy plots" which
# may help one to select the number of classes (please see the article cited
# in the references)
plot(output)
 ## 2D Example
output <- clustCombi(data = ex4.1)
# plots the hierarchy of combined solutions, then some "entropy plots" which
# may help one to select the number of classes (please see the article cited
# in the references)
plot(output)
## 2D Example
output <- clustCombi(data = ex4.1)
# plots the hierarchy of combined solutions, then some "entropy plots" which
# may help one to select the number of classes (please see the article cited
# in the references)
plot(output)
 ## 3D Example
output <- clustCombi(data = ex4.4.2)
# plots the hierarchy of combined solutions, then some "entropy plots" which
# may help one to select the number of classes (please see the article cited
# in the references)
plot(output)
## 3D Example
output <- clustCombi(data = ex4.4.2)
# plots the hierarchy of combined solutions, then some "entropy plots" which
# may help one to select the number of classes (please see the article cited
# in the references)
plot(output)
 # }
# }