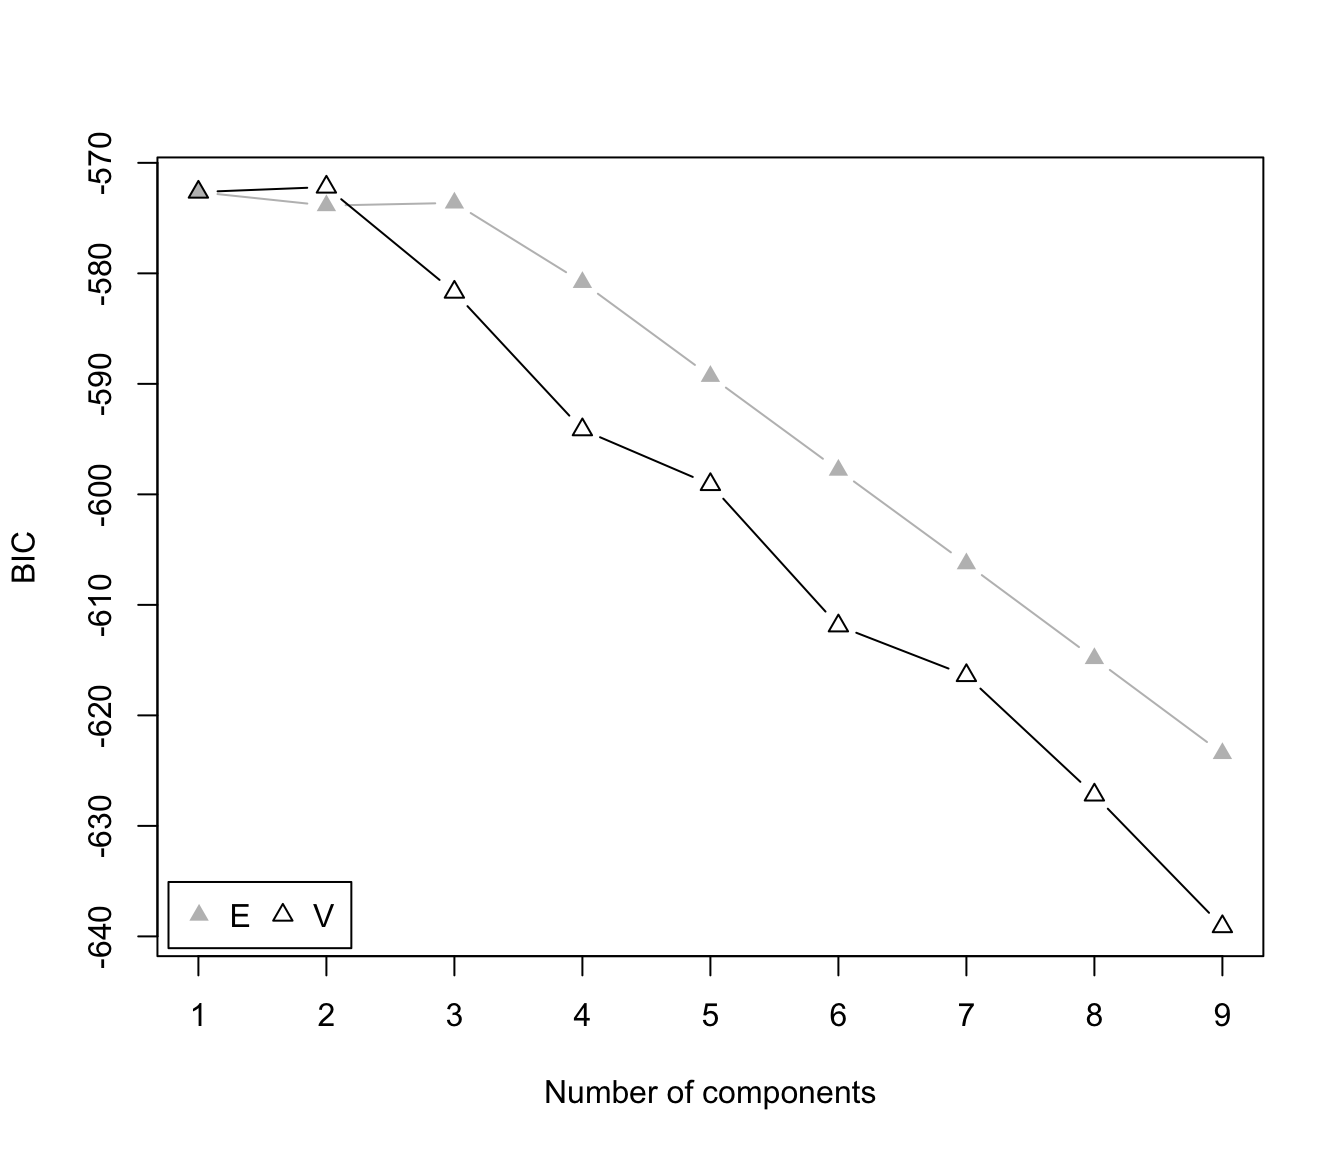
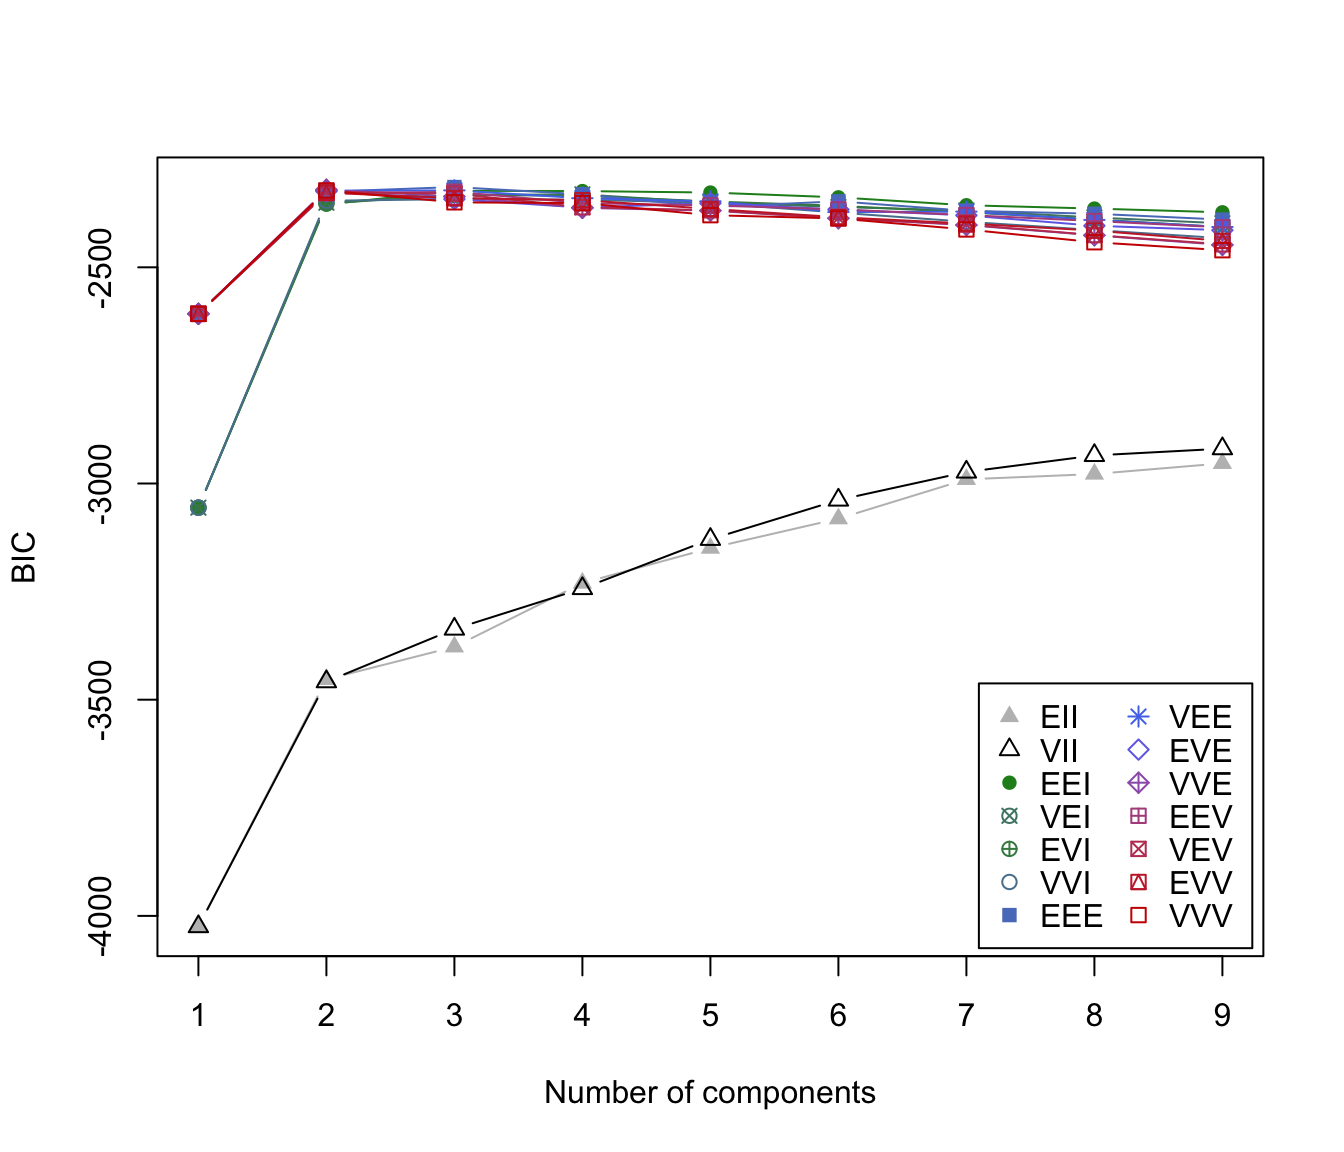
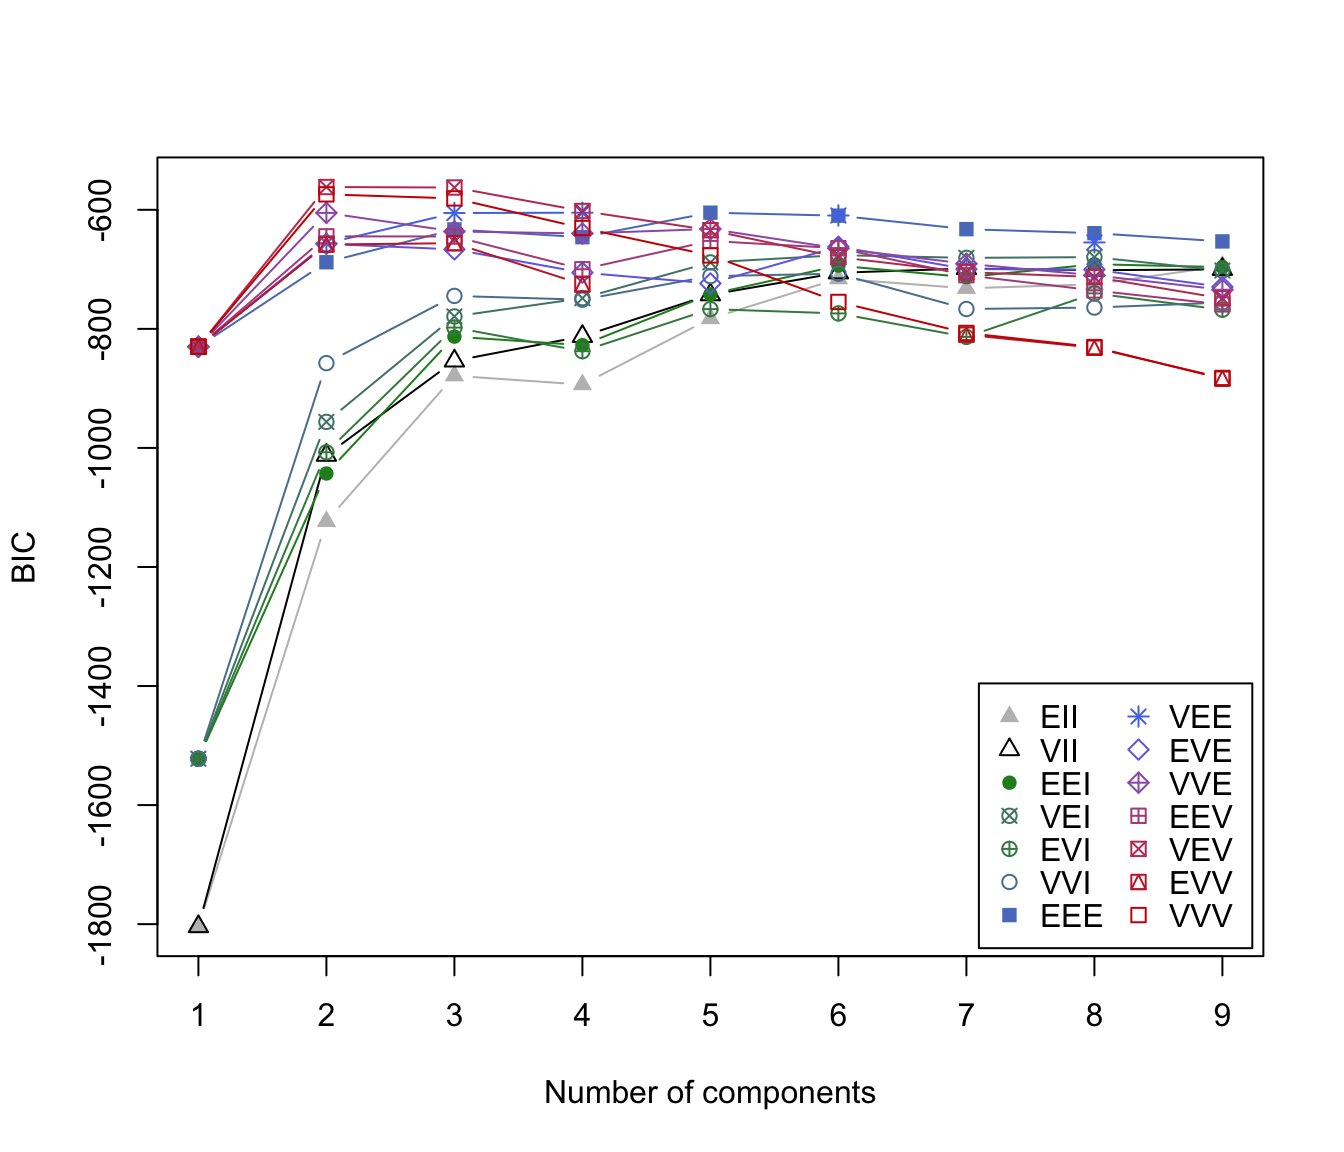
BIC Plot for Model-Based Clustering
plot.mclustBIC.RdPlots the BIC values returned by the mclustBIC function.
Arguments
- x
Output from
mclustBIC.- G
One or more numbers of components corresponding to models fit in
x. The default is to plot the BIC for all of the numbers of components fit.- modelNames
One or more model names corresponding to models fit in
x. The default is to plot the BIC for all of the models fit.- symbols
Either an integer or character vector assigning a plotting symbol to each unique class in
classification. Elements incolorscorrespond to classes in order of appearance in the sequence of observations (the order used by the functionunique). The default is given bymclust.options("classPlotSymbols").- colors
Either an integer or character vector assigning a color to each unique class in
classification. Elements incolorscorrespond to classes in order of appearance in the sequence of observations (the order used by the functionunique). The default is given bymclust.options("classPlotColors").- xlab
Optional label for the horizontal axis of the BIC plot.
- ylab
Label for the vertical axis of the BIC plot.
- legendArgs
Arguments to pass to the
legendfunction. Set toNULLfor no legend.- ...
Other graphics parameters.