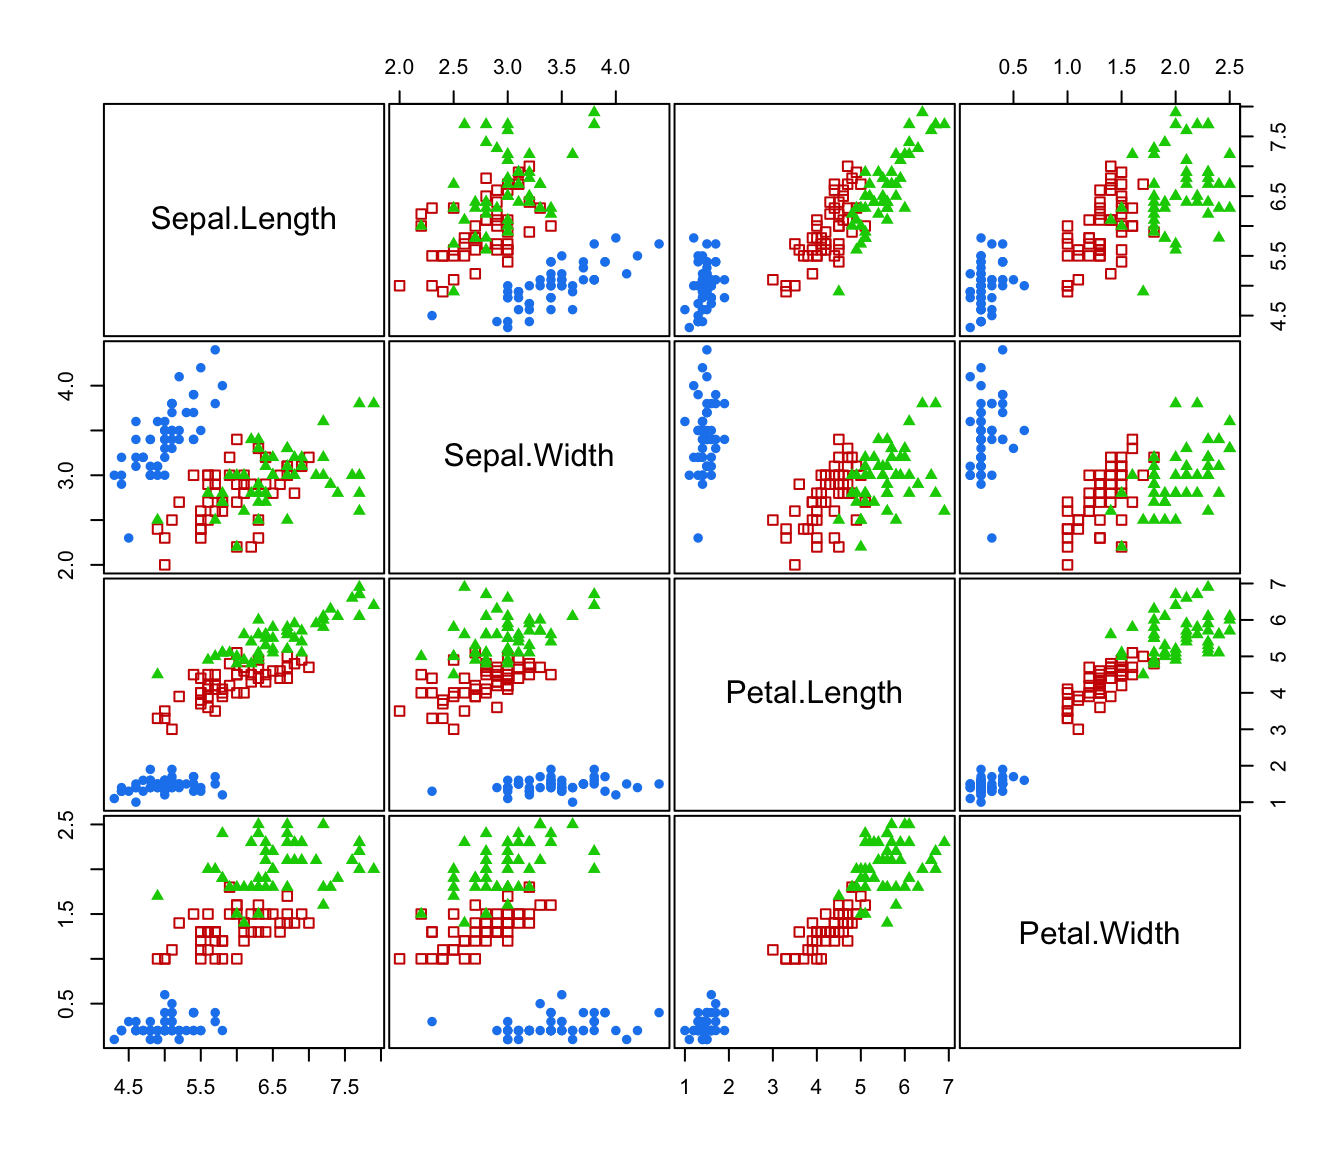
Pairwise Scatter Plots showing Classification
clPairs.RdCreates a scatter plot for each pair of variables in given data. Observations in different classes are represented by different colors and symbols.
Usage
clPairs(data, classification,
        symbols = NULL, colors = NULL, cex = NULL,
        labels = dimnames(data)[[2]], cex.labels = 1.5,
        gap = 0.2, grid = FALSE, ...)

clPairsLegend(x, y, class, col, pch, cex, box = TRUE, ...)
Arguments
- data
A numeric vector, matrix, or data frame of observations. Categorical variables are not allowed. If a matrix or data frame, rows correspond to observations and columns correspond to variables.
- classification
A numeric or character vector representing a classification of observations (rows) of
data.- symbols
Either an integer or character vector assigning a plotting symbol to each unique class in
classification. Elements insymbolscorrespond to classes in order of appearance in the sequence of observations (the order used by the functionunique). The default is given bymclust.options("classPlotSymbols").- colors
Either an integer or character vector assigning a color to each unique class in
classification. Elements incolorscorrespond to classes in order of appearance in the sequence of observations (the order used by the functionunique). The default is given bymclust.options("classPlotColors").- cex
A vector of numerical values specifying the size of the plotting symbol for each unique class in
classification. Values incexcorrespond to classes in order of appearance in the sequence of observations (the order used by the functionunique). By defaultcex = 1for all classes is used.- labels
A vector of character strings for labelling the variables. The default is to use the column dimension names of
data.- cex.labels
A numerical value specifying the size of the text labels.
- gap
An argument specifying the distance between subplots (see
pairs).- grid
A logical specifying if grid lines should be added to panels (see
grid).- x,y
The x and y co-ordinates with respect to a graphic device having plotting region coordinates
par("usr" = c(0,1,0,1)).- class
The class labels.
- box
A logical, if
TRUEthen a box is drawn around the current plot figure.- col, pch
The colors and plotting symbols appearing in the legend.
- ...
For a
clPairscall may be additional arguments to be passed topairs. For aclPairsLegendcall may be additional arguments to be passed tolegend.
Details
The function clPairs() draws scatter plots on the current graphics device for each combination of variables in data. Observations of different classifications are labeled with different symbols.
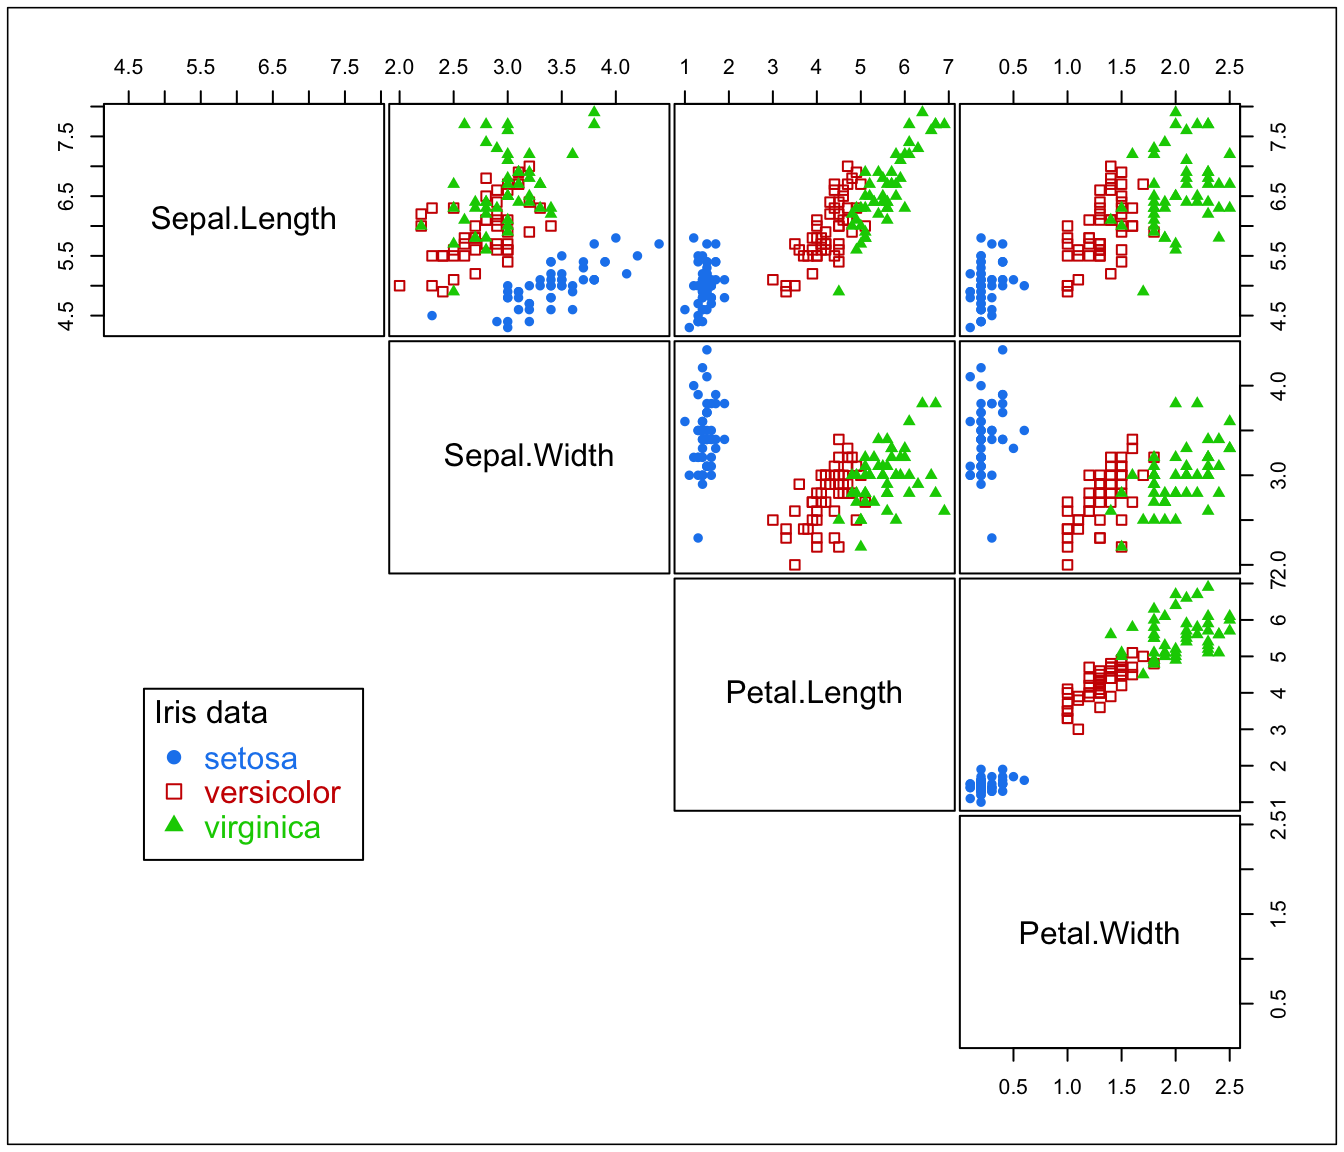
The function clPairsLegend() can be used to add a legend. See examples below.
Value
The function clPairs() invisibly returns a list with the following components:
- class
A character vector of class labels.
- col
A vector of colors used for each class.
- pch
A vector of plotting symbols used for each class.