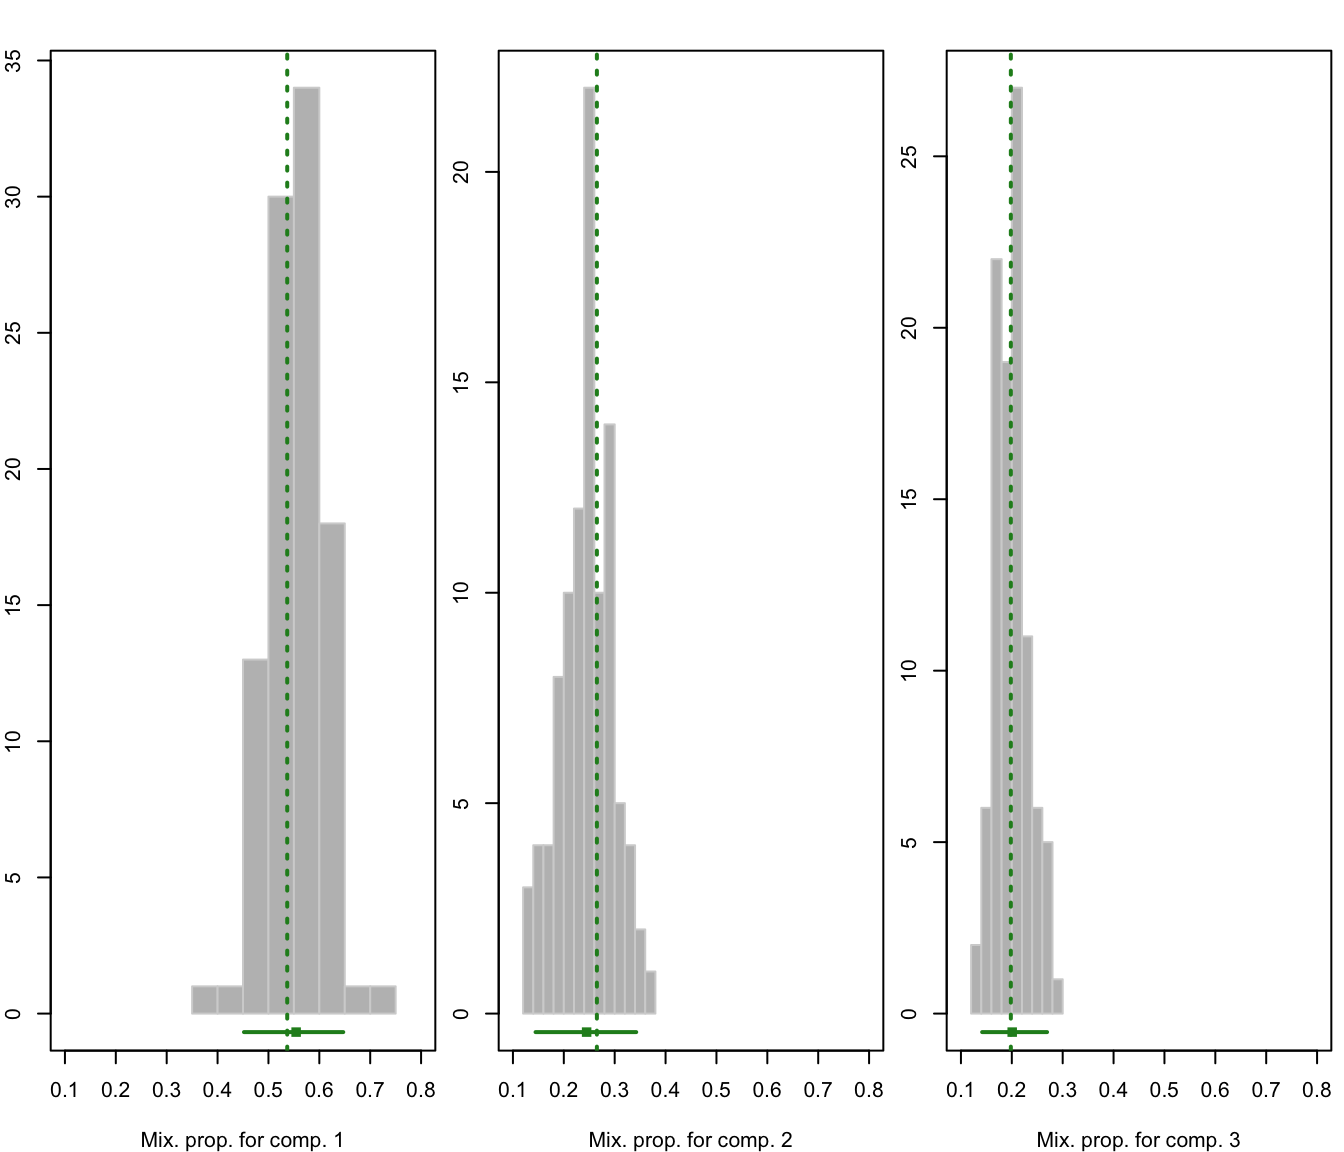
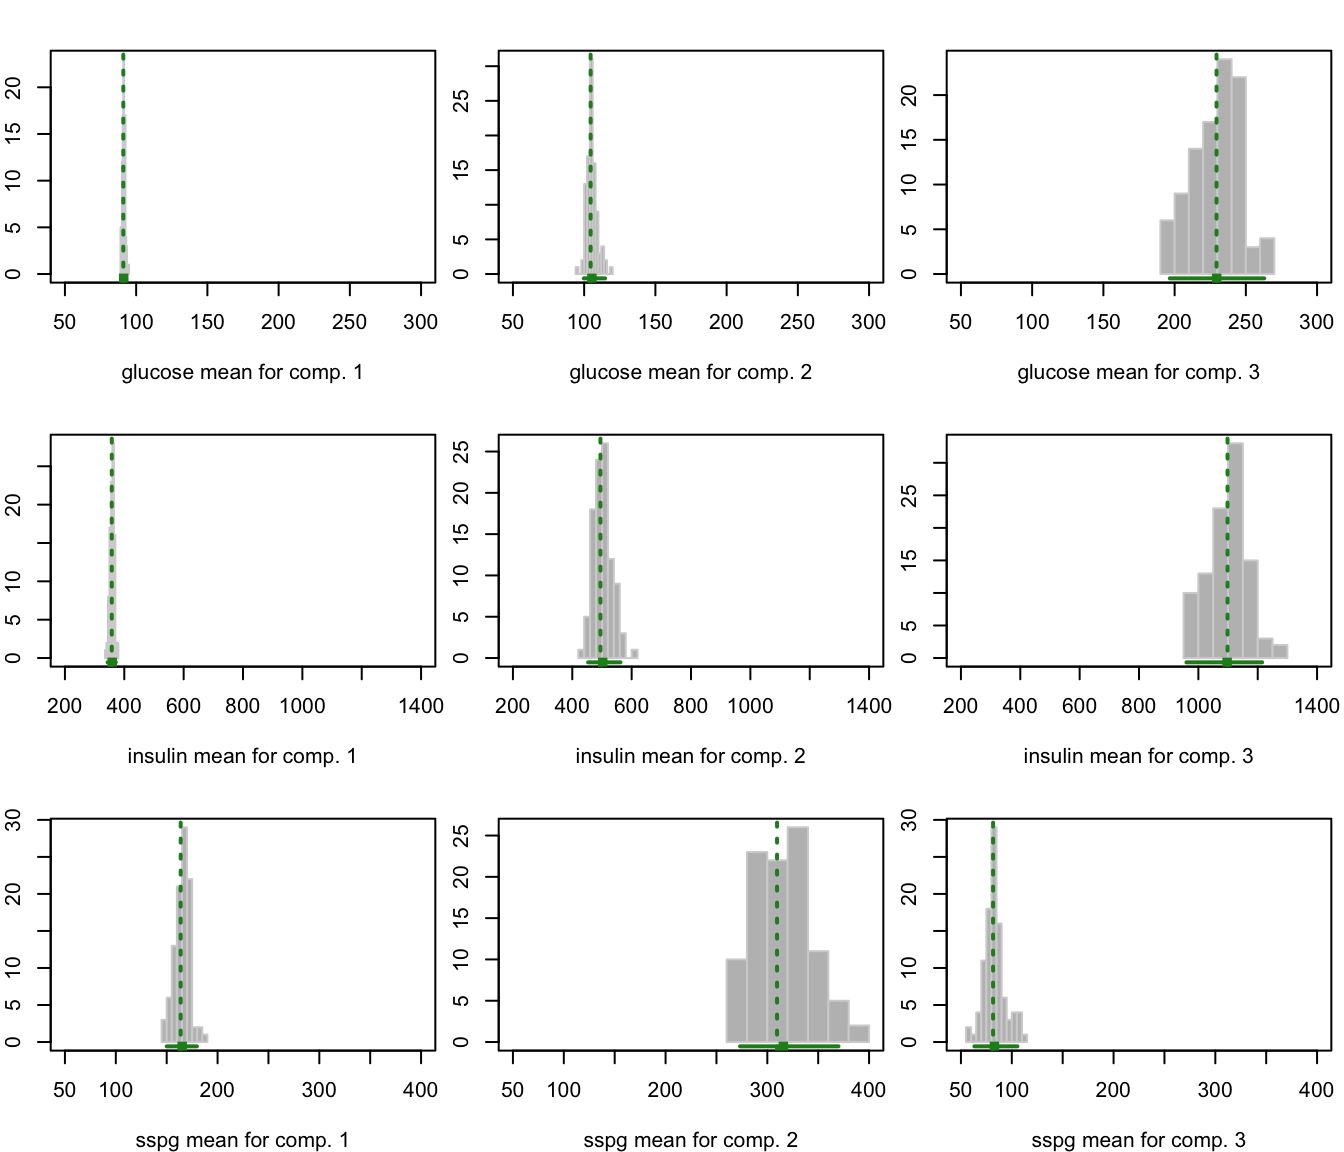
Plot of bootstrap distributions for mixture model parameters
plot.MclustBoostrap.RdPlots the bootstrap distribution of parameters as returned by the MclustBootstrap function.
Arguments
- x
Object returned by
MclustBootstrap.- what
Character string specifying if mixing proportions (
"pro"), component means ("mean") or component variances ("var") should be drawn.- show.parest
A logical specifying if the parameter estimate should be drawn as vertical line.
- show.confint
A logical specifying if the resampling-based confidence interval should be drawn at the bottom of the graph. Confidence level can be provided as further argument
conf.level; seesummary.MclustBootstrap.- hist.col
The color to be used to fill the bars of the histograms.
- hist.border
The color of the border around the bars of the histograms.
- breaks
The number of breaks used in histogram to visualize the bootstrap distribution. When
NA(default), it is computed as the maximum between the "Sturges" and "Freedman-Diaconis" methods; seenclass.Sturgesandnclass.FD.- col, lwd, lty
The color, line width and line type to be used to represent the estimated parameters and confidence intervals.
- xlab
Optional label for the horizontal axis.
- xlim, ylim
A two-values vector of axis range for, respectively, horizontal and vertical axis.
- ...
Other graphics parameters.