Uncertainty Plot for Model-Based Clustering
uncerPlot.RdDisplays the uncertainty in converting a conditional probablility from EM to a classification in model-based clustering.
Arguments
- z
A matrix whose [i,k]th entry is the conditional probability of the ith observation belonging to the kth component of the mixture.
- truth
A numeric or character vector giving the true classification of the data.
- ...
Provided to allow lists with elements other than the arguments can be passed in indirect or list calls with
do.call.
Value
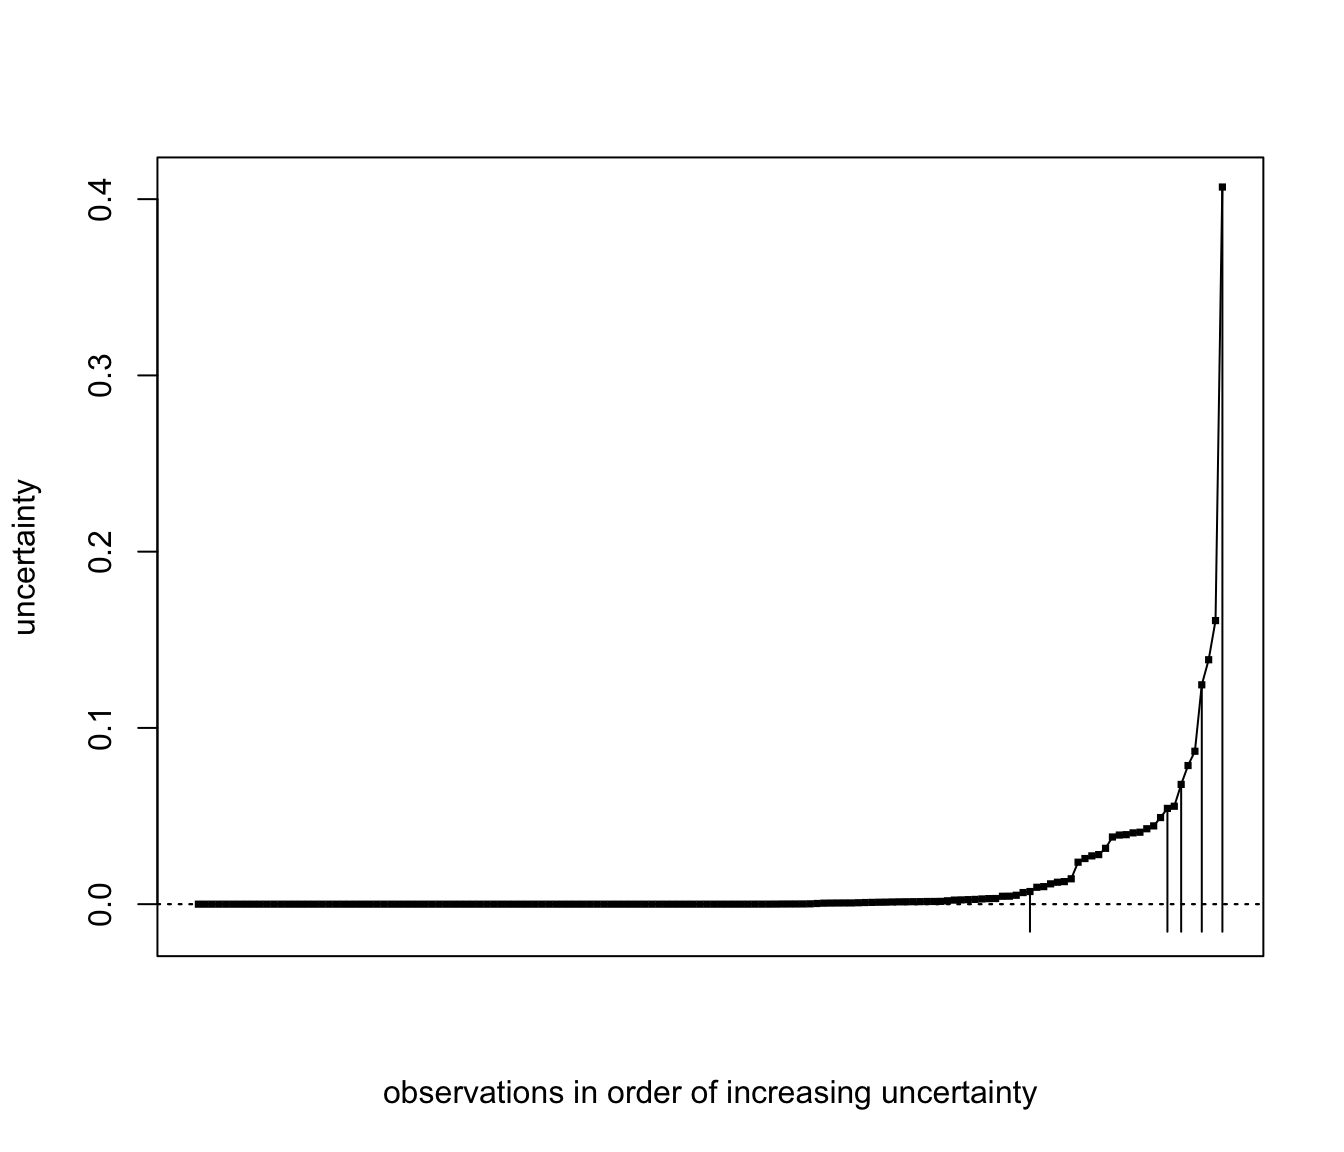
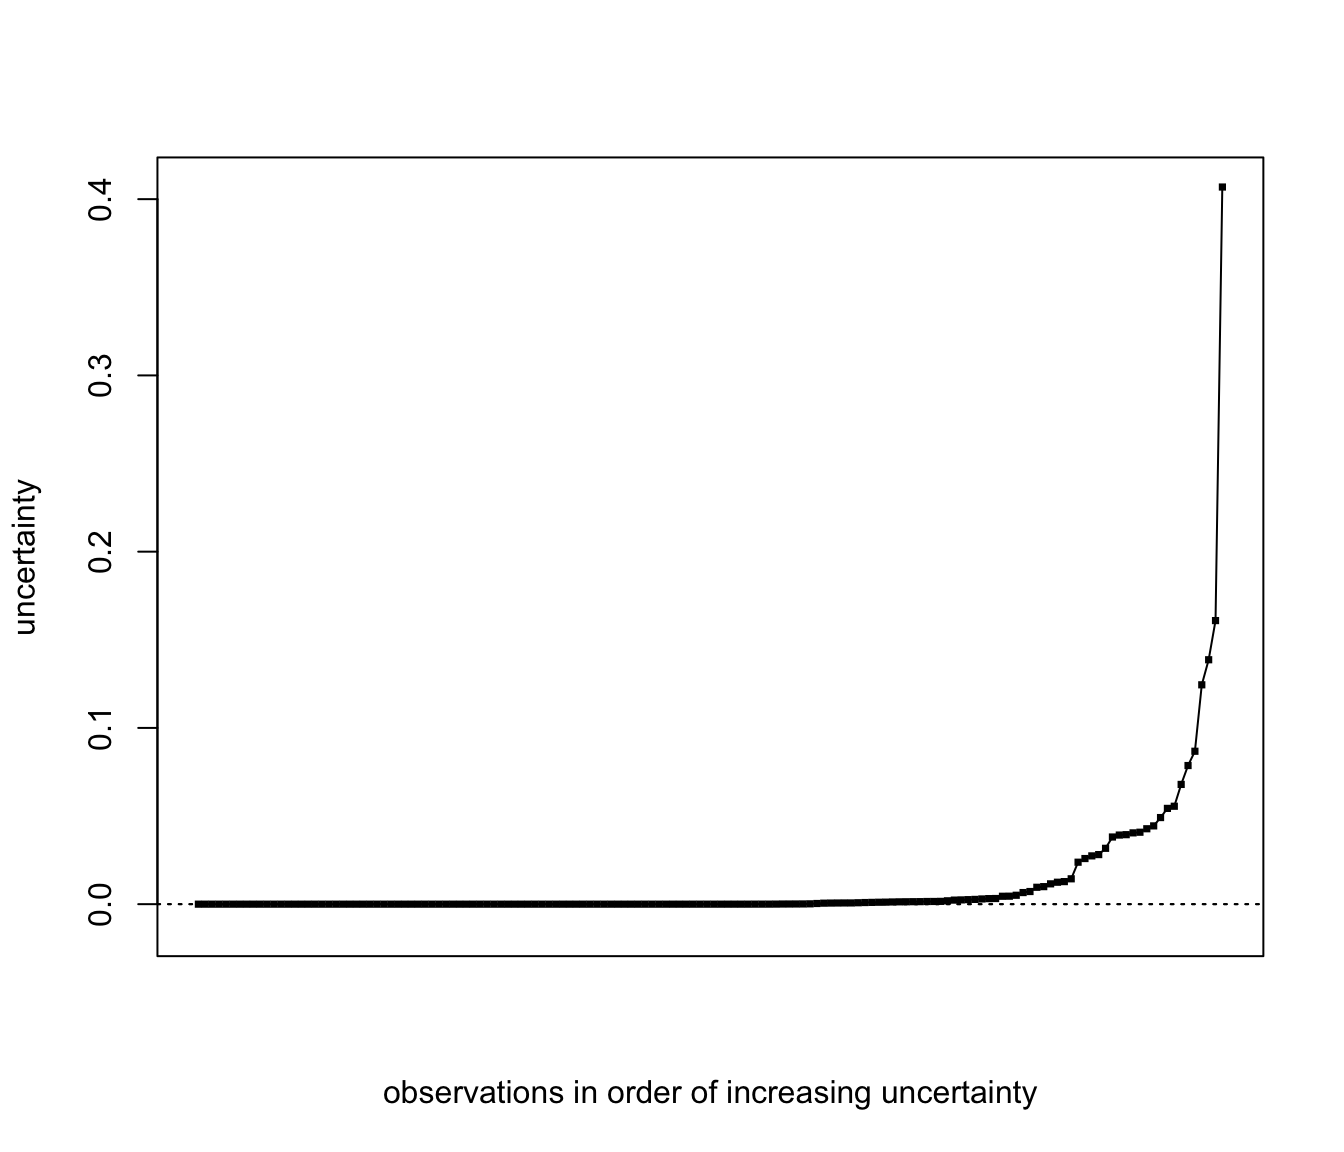
A plot of the uncertainty profile of the data,
with uncertainties in increasing order of magnitude.
If truth is supplied and the number of
classes is the same as the number of columns of
z, the uncertainty
of the misclassified data is marked by vertical lines on the plot.
Details
When truth is provided and the number of classes is compatible
with z, the function compareClass is used to to find best
correspondence between classes in truth and z.
Examples
irisModel3 <-  Mclust(iris[,-5], G = 3)

uncerPlot(z = irisModel3$z)


uncerPlot(z = irisModel3$z, truth = iris[,5])