Plot one-dimensional data modeled by an MVN mixture.
mclust1Dplot.RdPlot one-dimensional data given parameters of an MVN mixture model for the data.
Usage
mclust1Dplot(data, parameters = NULL, z = NULL,
             classification = NULL, truth = NULL, uncertainty = NULL,
             what = c("classification", "density", "error", "uncertainty"),
             symbols = NULL, colors = NULL, ngrid = length(data),
             xlab = NULL, ylab = NULL,
             xlim = NULL, ylim = NULL,
             cex = 1, main = FALSE, ...)
Arguments
- data
A numeric vector of observations. Categorical variables are not allowed.
- parameters
A named list giving the parameters of an MCLUST model, used to produce superimposing ellipses on the plot. The relevant components are as follows:
proMixing proportions for the components of the mixture. There should one more mixing proportion than the number of Gaussian components if the mixture model includes a Poisson noise term.
meanThe mean for each component. If there is more than one component, this is a matrix whose kth column is the mean of the kth component of the mixture model.
varianceA list of variance parameters for the model. The components of this list depend on the model specification. See the help file for
mclustVariancefor details.
- z
A matrix in which the
[i,k]th entry gives the probability of observation i belonging to the kth class. Used to computeclassificationanduncertaintyif those arguments aren't available.- classification
A numeric or character vector representing a classification of observations (rows) of
data. If present argumentzwill be ignored.- truth
A numeric or character vector giving a known classification of each data point. If
classificationorzis also present, this is used for displaying classification errors.- uncertainty
A numeric vector of values in (0,1) giving the uncertainty of each data point. If present argument
zwill be ignored.- what
Choose from one of the following options:
"classification"(default),"density","error","uncertainty".- symbols
Either an integer or character vector assigning a plotting symbol to each unique class
classification. Elements insymbolscorrespond to classes inclassificationin order of appearance in the observations (the order used by the functionunique). The default is to use a single plotting symbol |. Classes are delineated by showing them in separate lines above the whole of the data.- colors
Either an integer or character vector assigning a color to each unique class
classification. Elements incolorscorrespond to classes in order of appearance in the observations (the order used by the functionunique). The default is given ismclust.options("classPlotColors").- ngrid
Number of grid points to use for density computation over the interval spanned by the data. The default is the length of the data set.
- xlab, ylab
An argument specifying a label for the axes.
- xlim, ylim
An argument specifying bounds of the plot. This may be useful for when comparing plots.
- cex
An argument specifying the size of the plotting symbols. The default value is 1.
- main
A logical variable or
NULLindicating whether or not to add a title to the plot identifying the dimensions used.- ...
Other graphics parameters.
Value
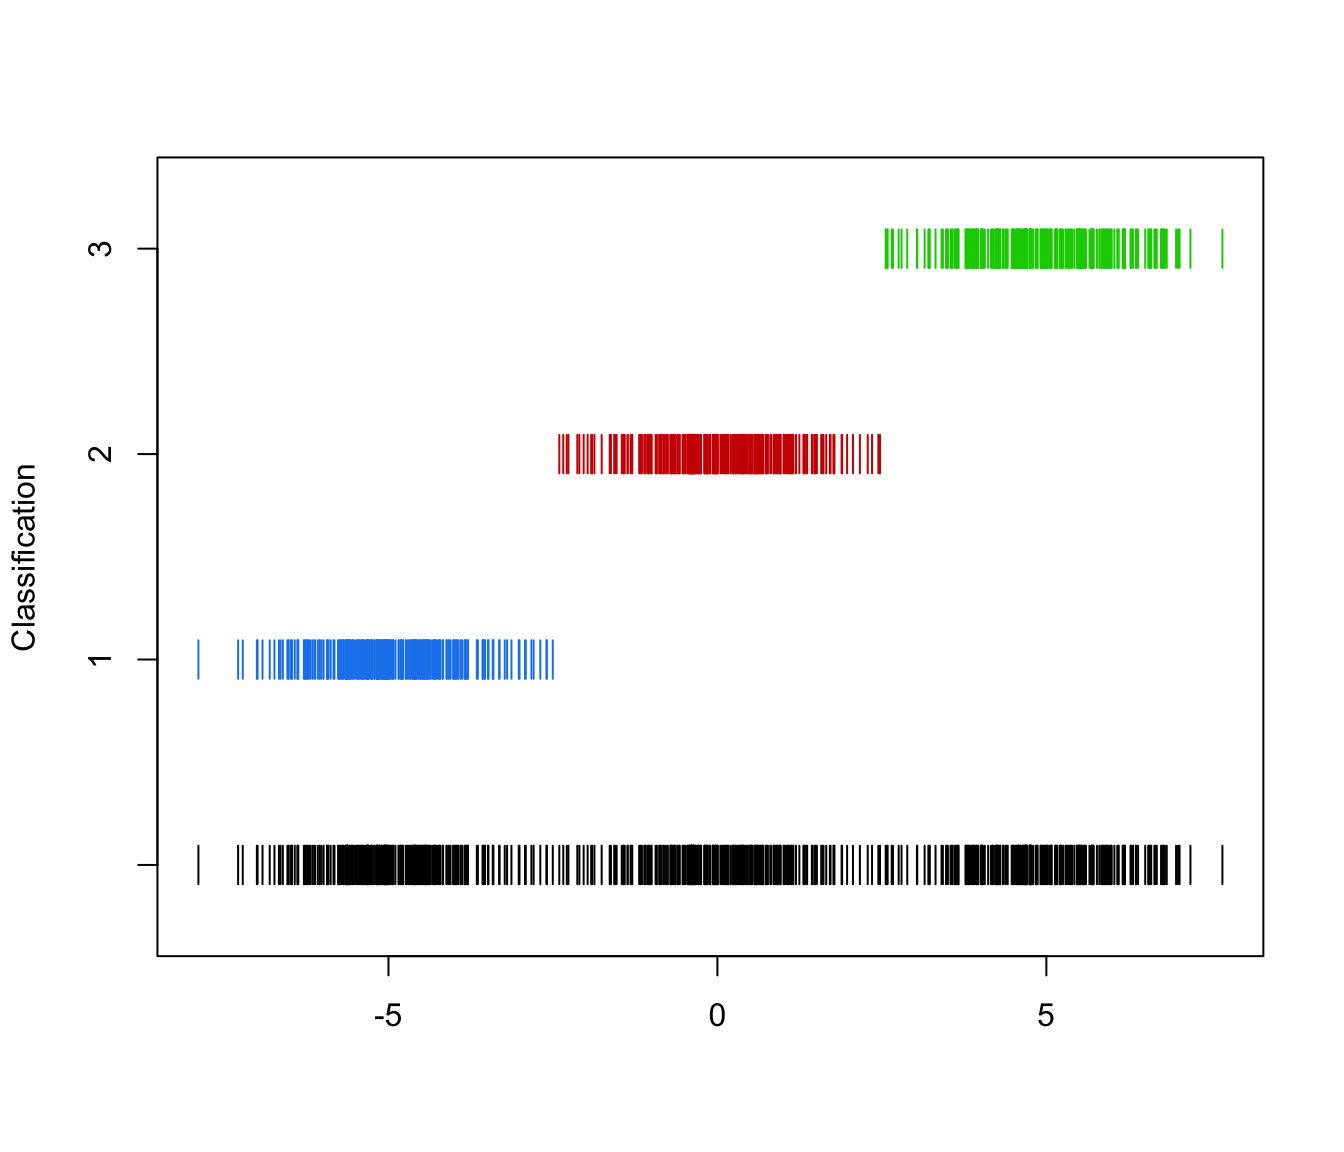
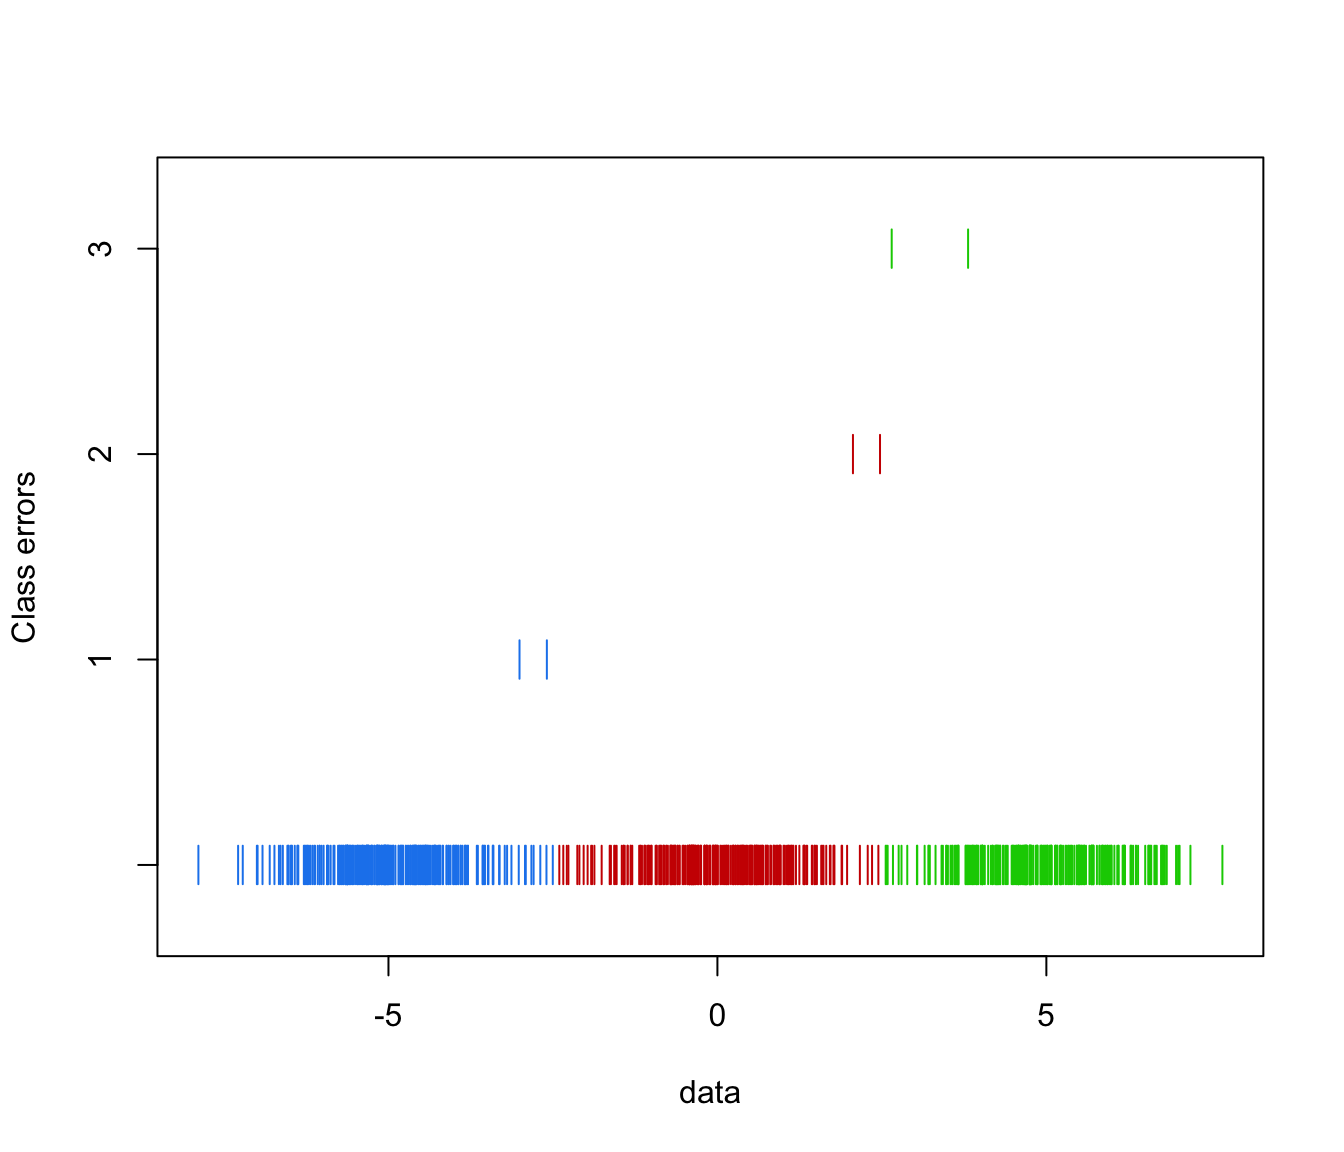
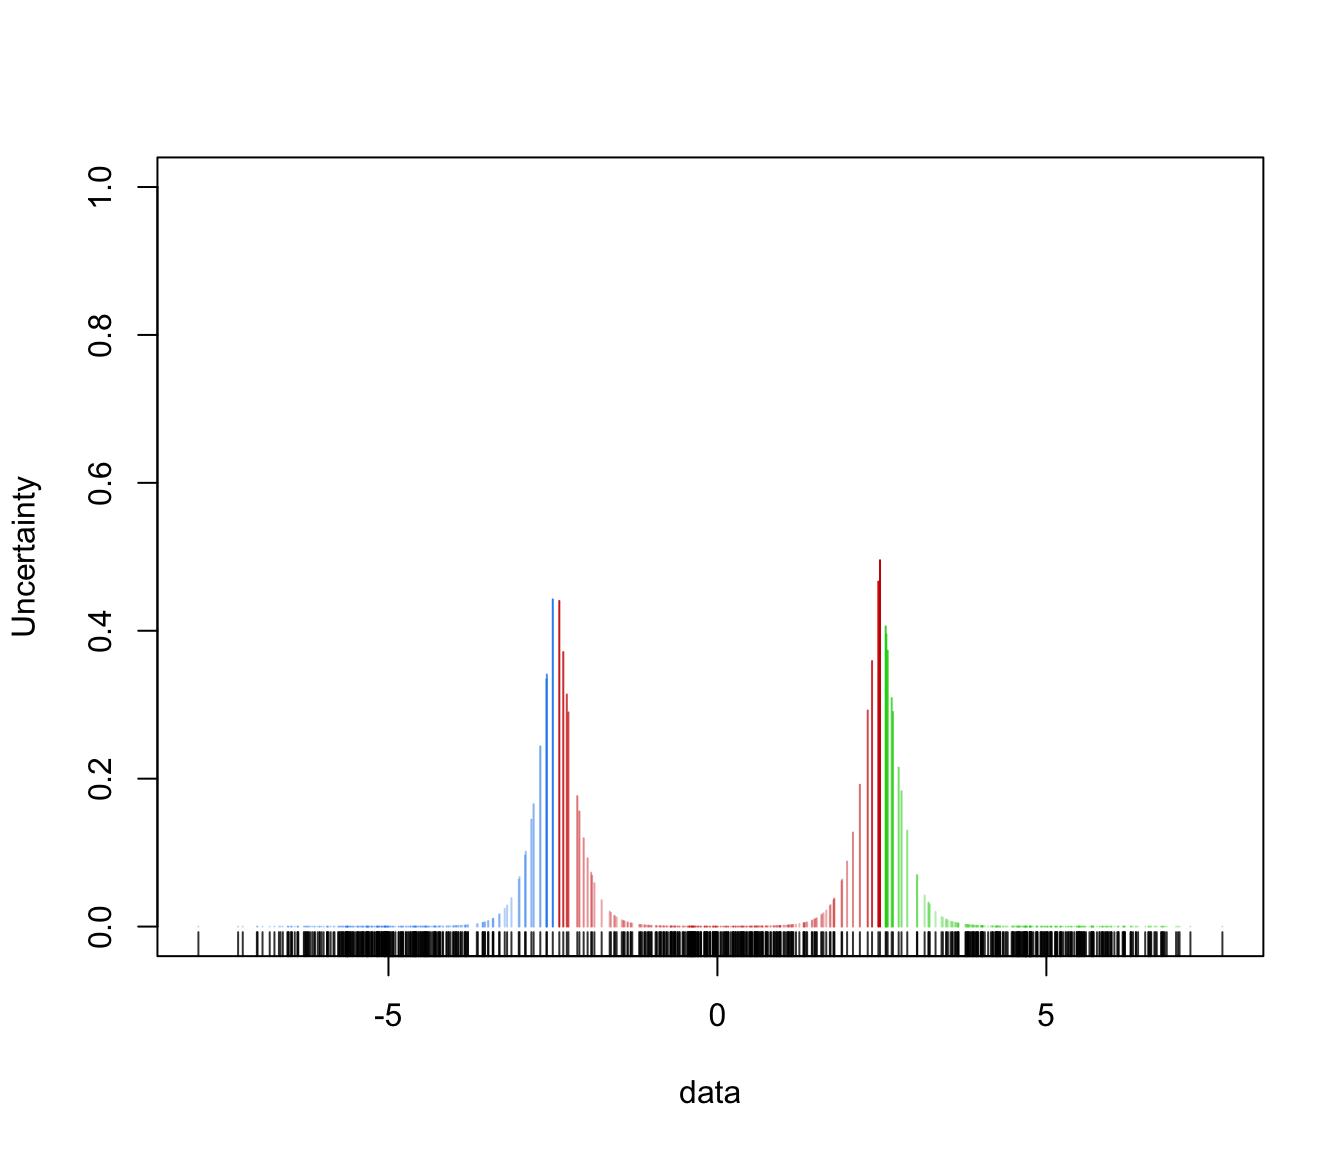
A plot showing location of the mixture components, classification, uncertainty, density and/or classification errors. Points in the different classes are shown in separated levels above the whole of the data.
Examples
# \donttest{
n <- 250 ## create artificial data
set.seed(1)
y <- c(rnorm(n,-5), rnorm(n,0), rnorm(n,5))
yclass <- c(rep(1,n), rep(2,n), rep(3,n))
yModel <- Mclust(y)
mclust1Dplot(y, parameters = yModel$parameters, z = yModel$z,
what = "classification")
 mclust1Dplot(y, parameters = yModel$parameters, z = yModel$z,
what = "error", truth = yclass)
mclust1Dplot(y, parameters = yModel$parameters, z = yModel$z,
what = "error", truth = yclass)
 mclust1Dplot(y, parameters = yModel$parameters, z = yModel$z,
what = "density")
mclust1Dplot(y, parameters = yModel$parameters, z = yModel$z,
what = "density")
 mclust1Dplot(y, z = yModel$z, parameters = yModel$parameters,
what = "uncertainty")
mclust1Dplot(y, z = yModel$z, parameters = yModel$parameters,
what = "uncertainty")
 # }
# }